As a long-term shareowner, we view proxy voting as one of the primary tools to influence a company's operations and corporate governance practices. That's why it's important for shareowners like us to vote our proxies based on the full understanding of publicly available information.

We vote our proxies in accordance with our Governance & Sustainability Principles, and publicly post our votes in advance of each company's shareowner meeting.

Governance & Sustainability Principles

As part of the Total Fund Policy adopted by the CalPERS Board’s Investment Committee, we have a set of Governance and Sustainability Principles. For more information on our proxy voting, read CalPERS Governance & Sustainability Principles (PDF).

Proxy Voting Guidelines

Our proxy voting guidelines provide an overview of our general philosophy and approach to the most important and commonly presented proxy voting items. Our proxy voting guidelines should be read in conjunction with CalPERS’ Governance & Sustainability Principles. We vote our proxies in a manner consistent with these principles and in the interests of our beneficiaries. Read more about our Proxy Voting Guidelines (PDF) and Executive Compensation Analysis Framework (PDF).

Notable Proxy Votes

We publish Notable Proxy Votes to encourage other shareowners to vote in accordance with us. All votes are provided for informational purposes only and don’t constitute investment advice.

Proxy Solicitations

We conduct proxy solicitations on shareowner proposals that either we file or that are aligned with our initiatives. You can access our proxy solicitations at the U.S. Securities and Exchange Commission website.

Vote Disclosure

We publish our proxy voting decisions to encourage shareowners to vote in accordance with us. These votes are for informational purposes only and not intended as investment advice.

To access a record of our proxy votes since January 1, 2015, visit Global Proxy Voting Decisions.

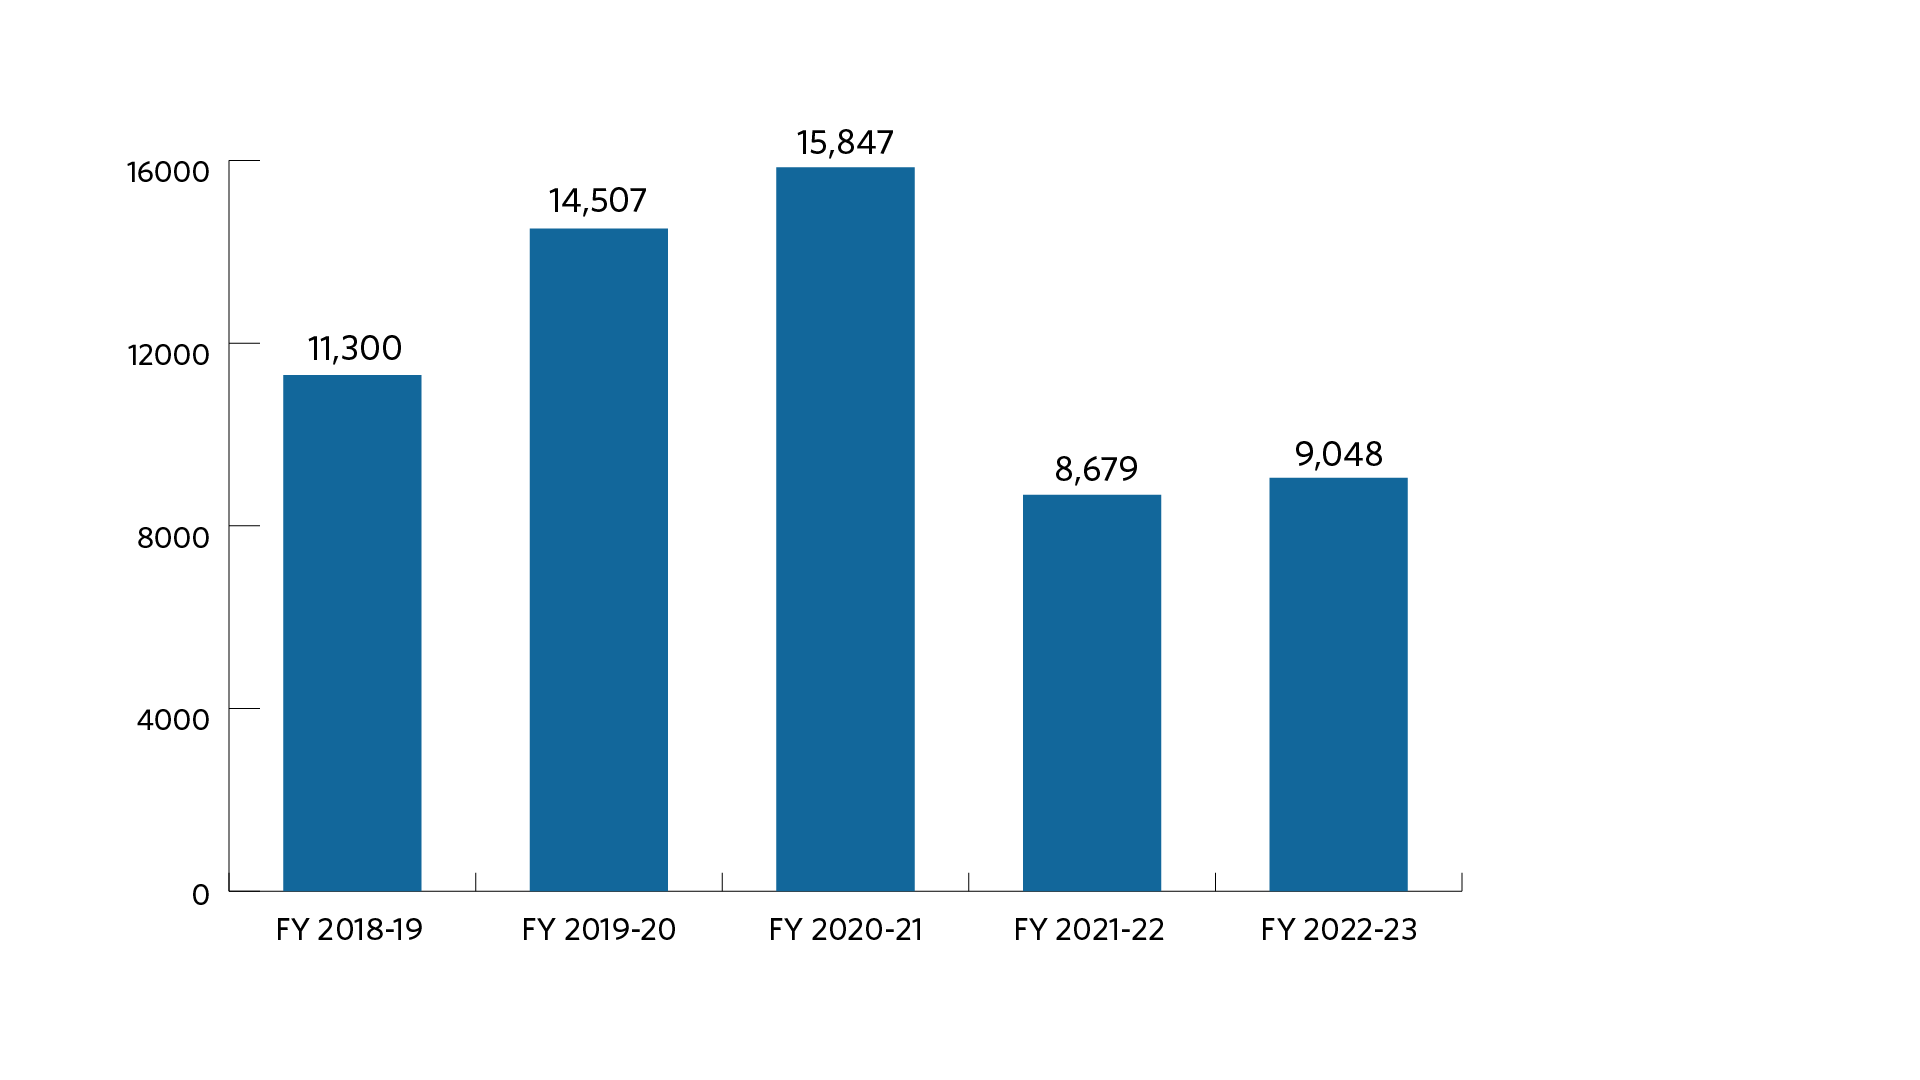
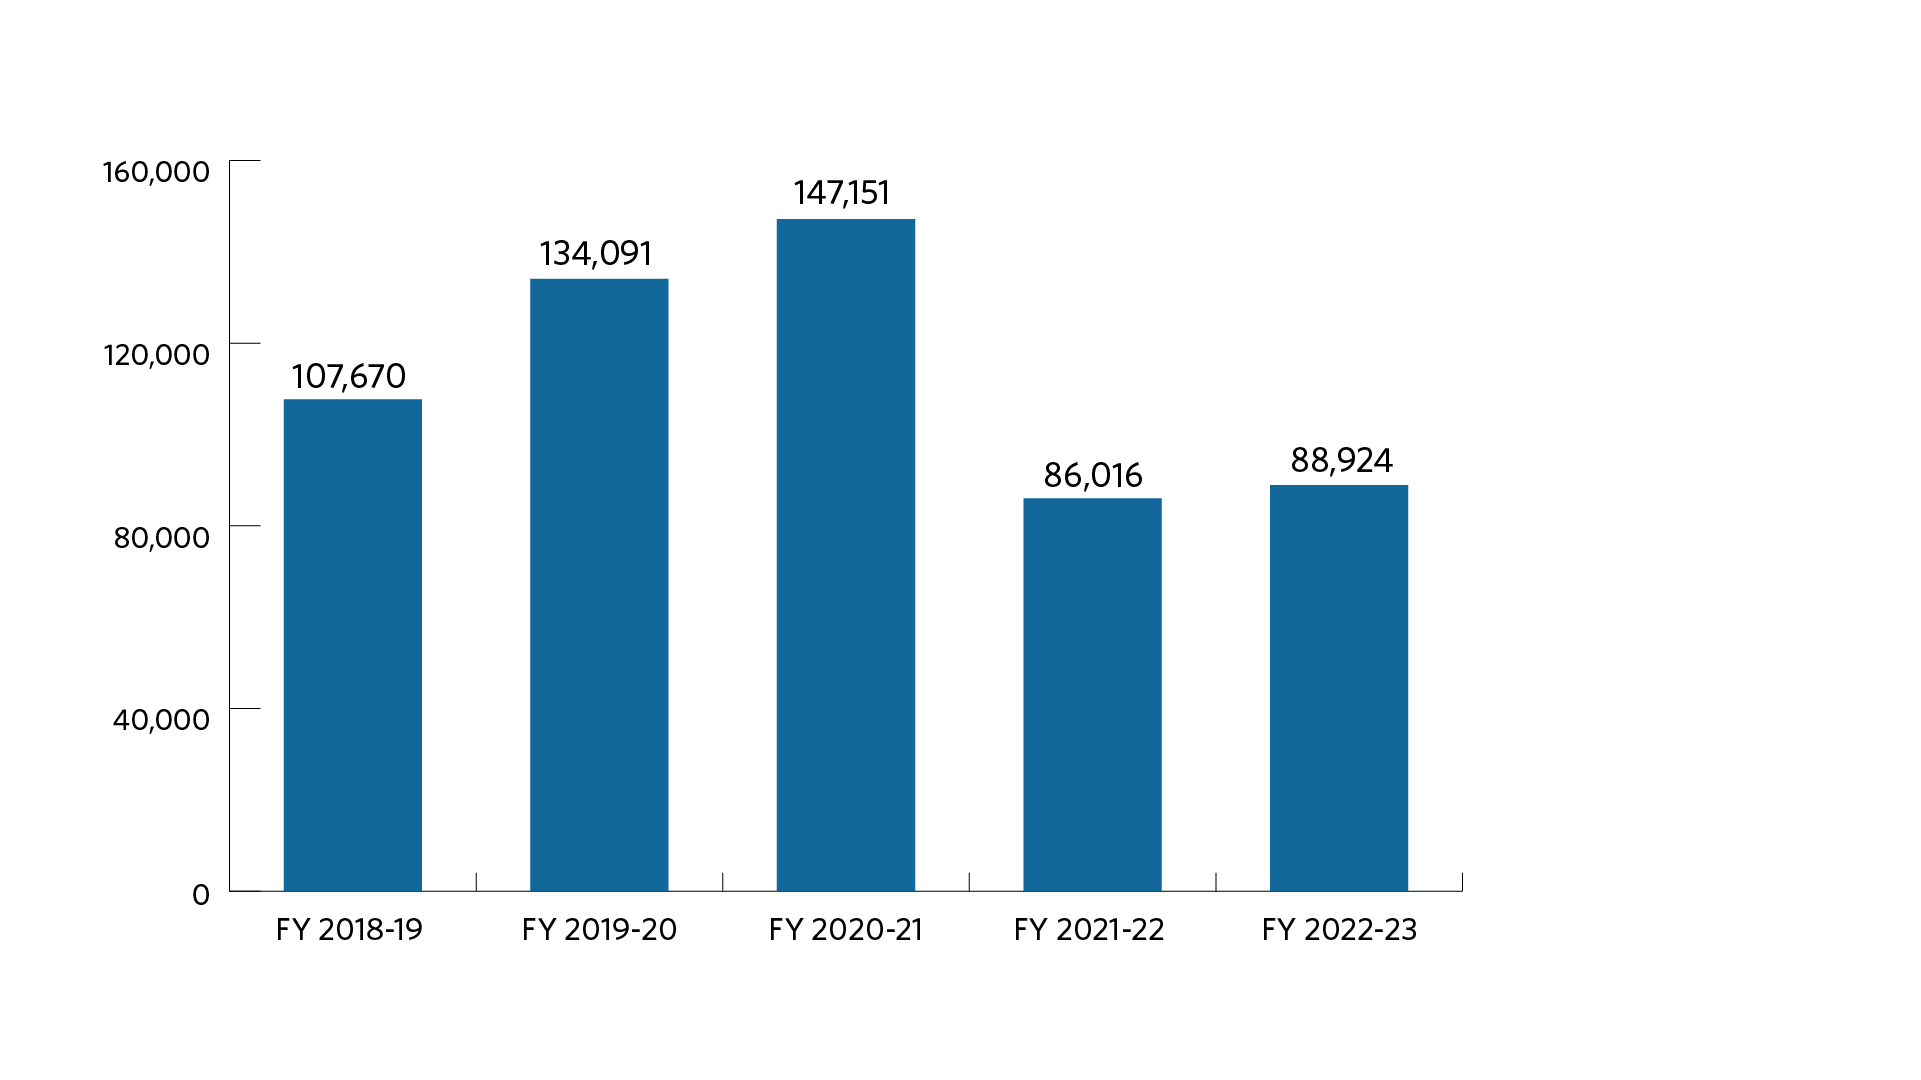
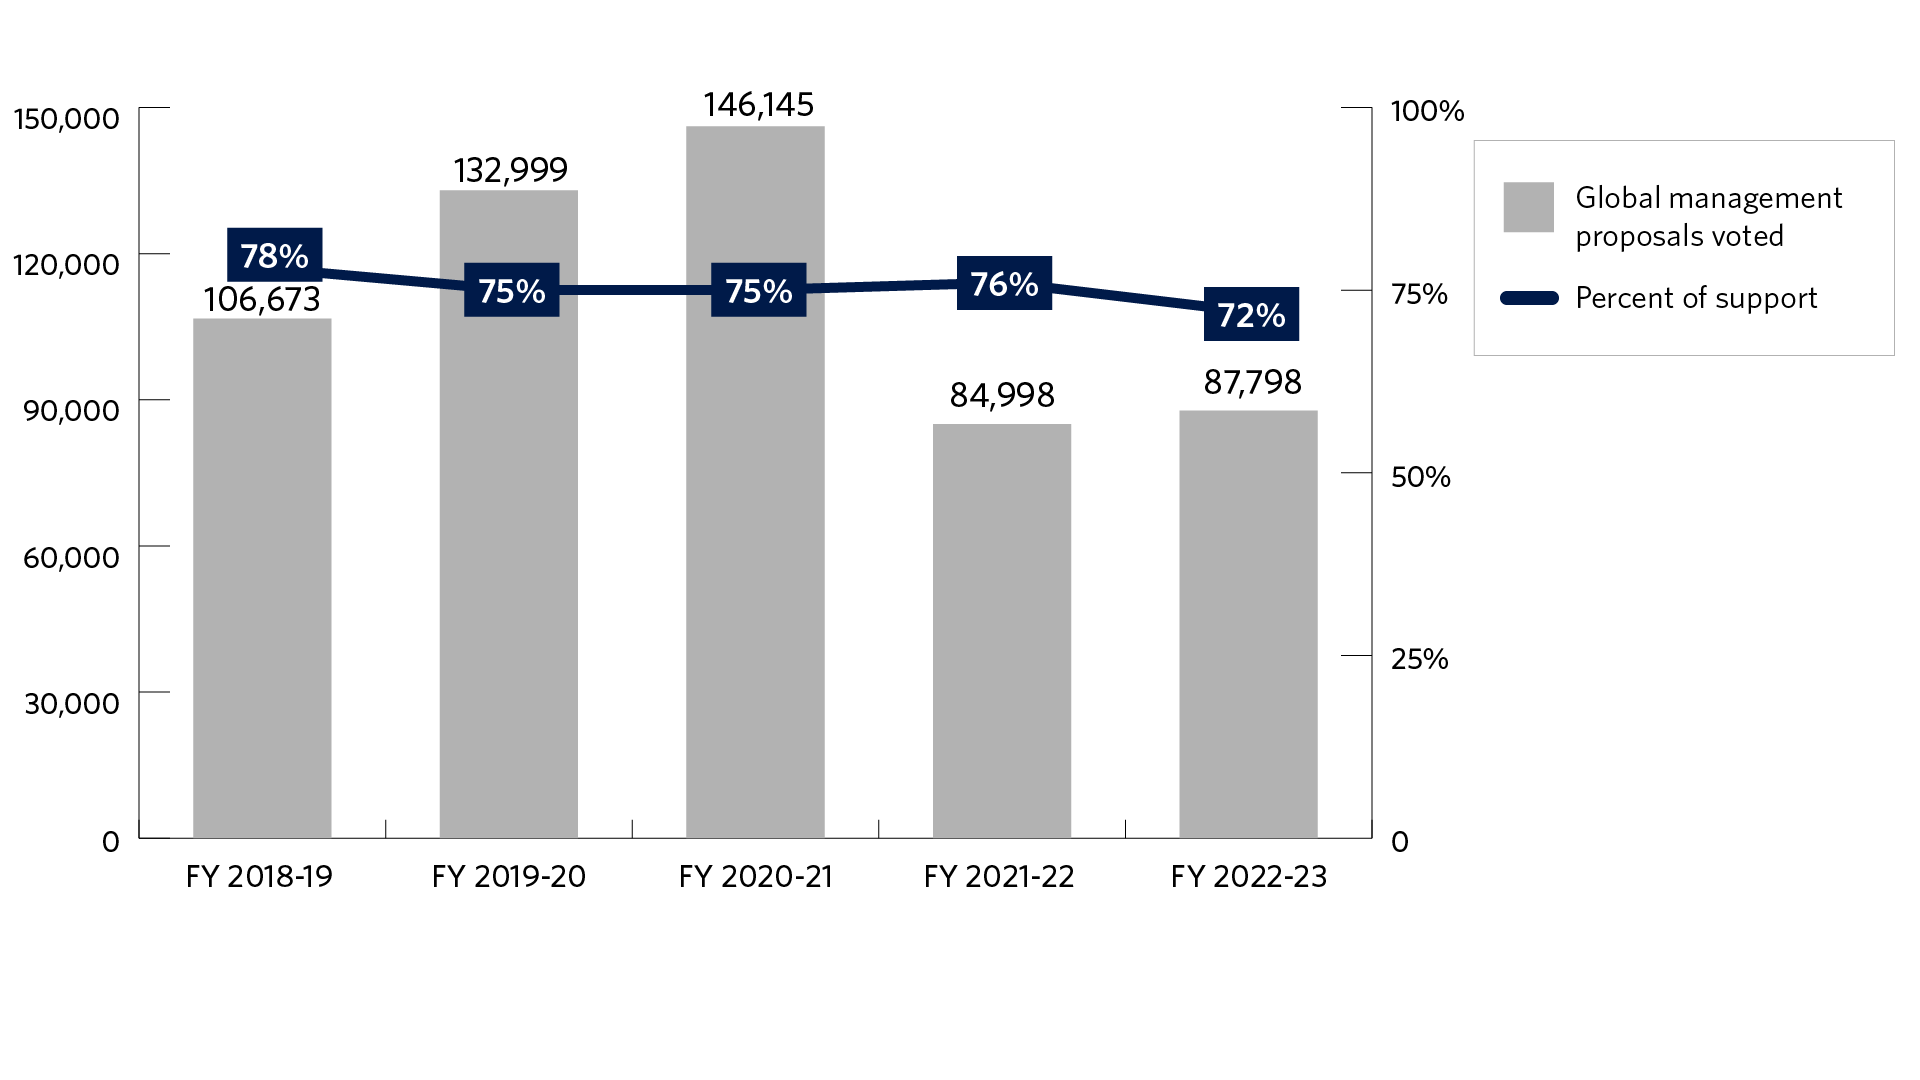
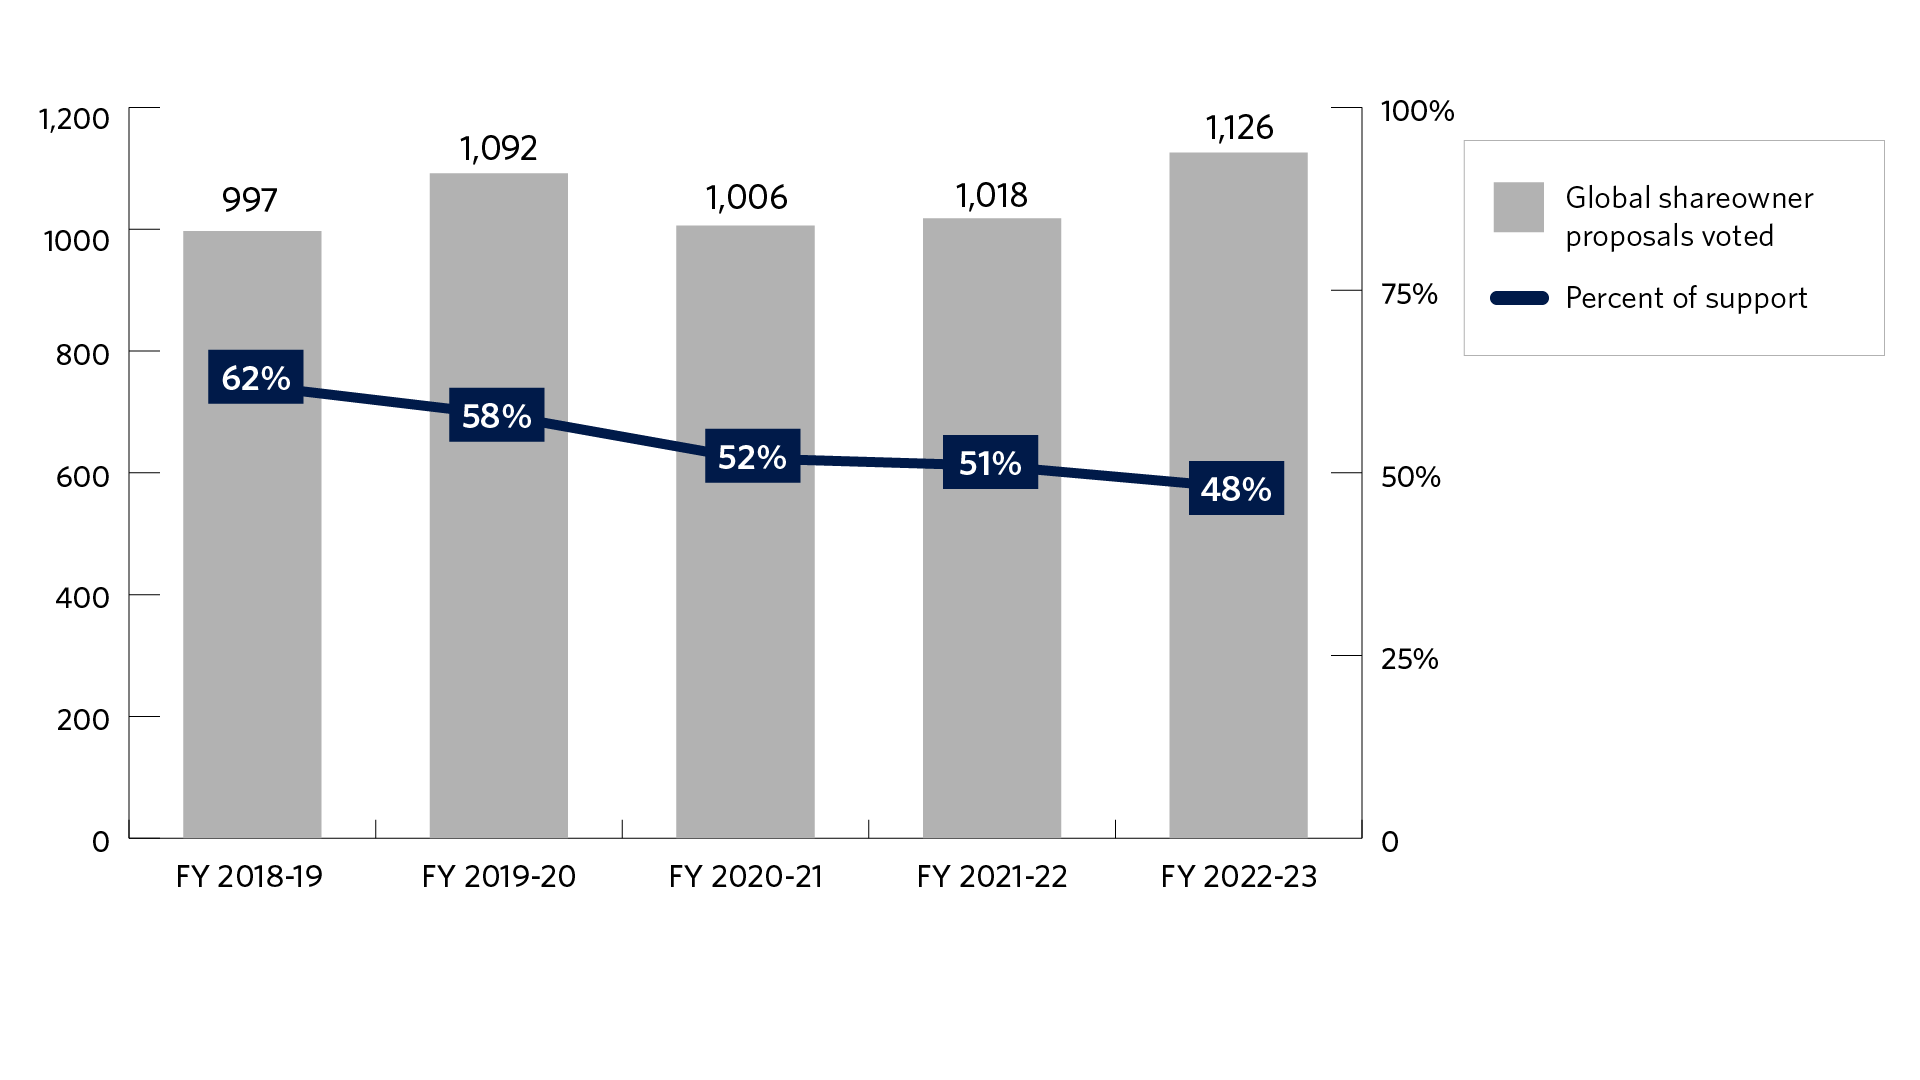
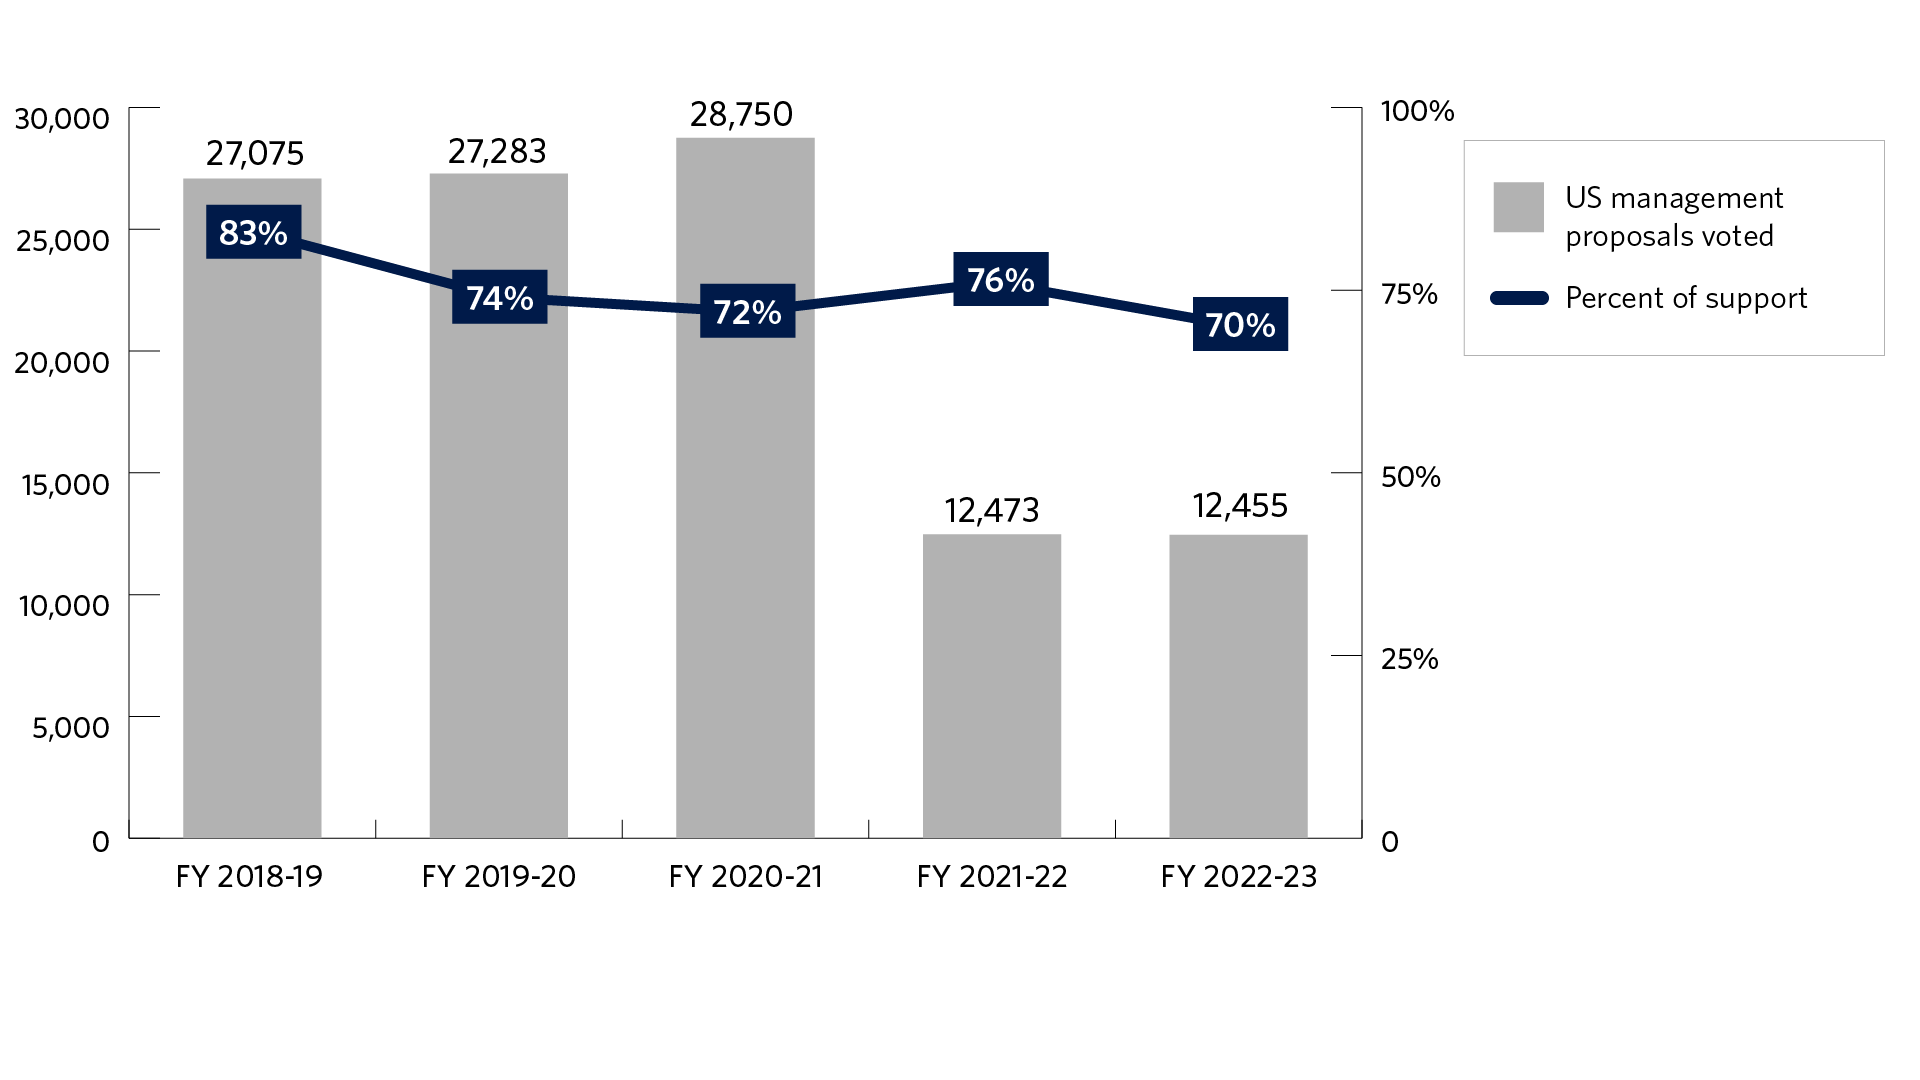
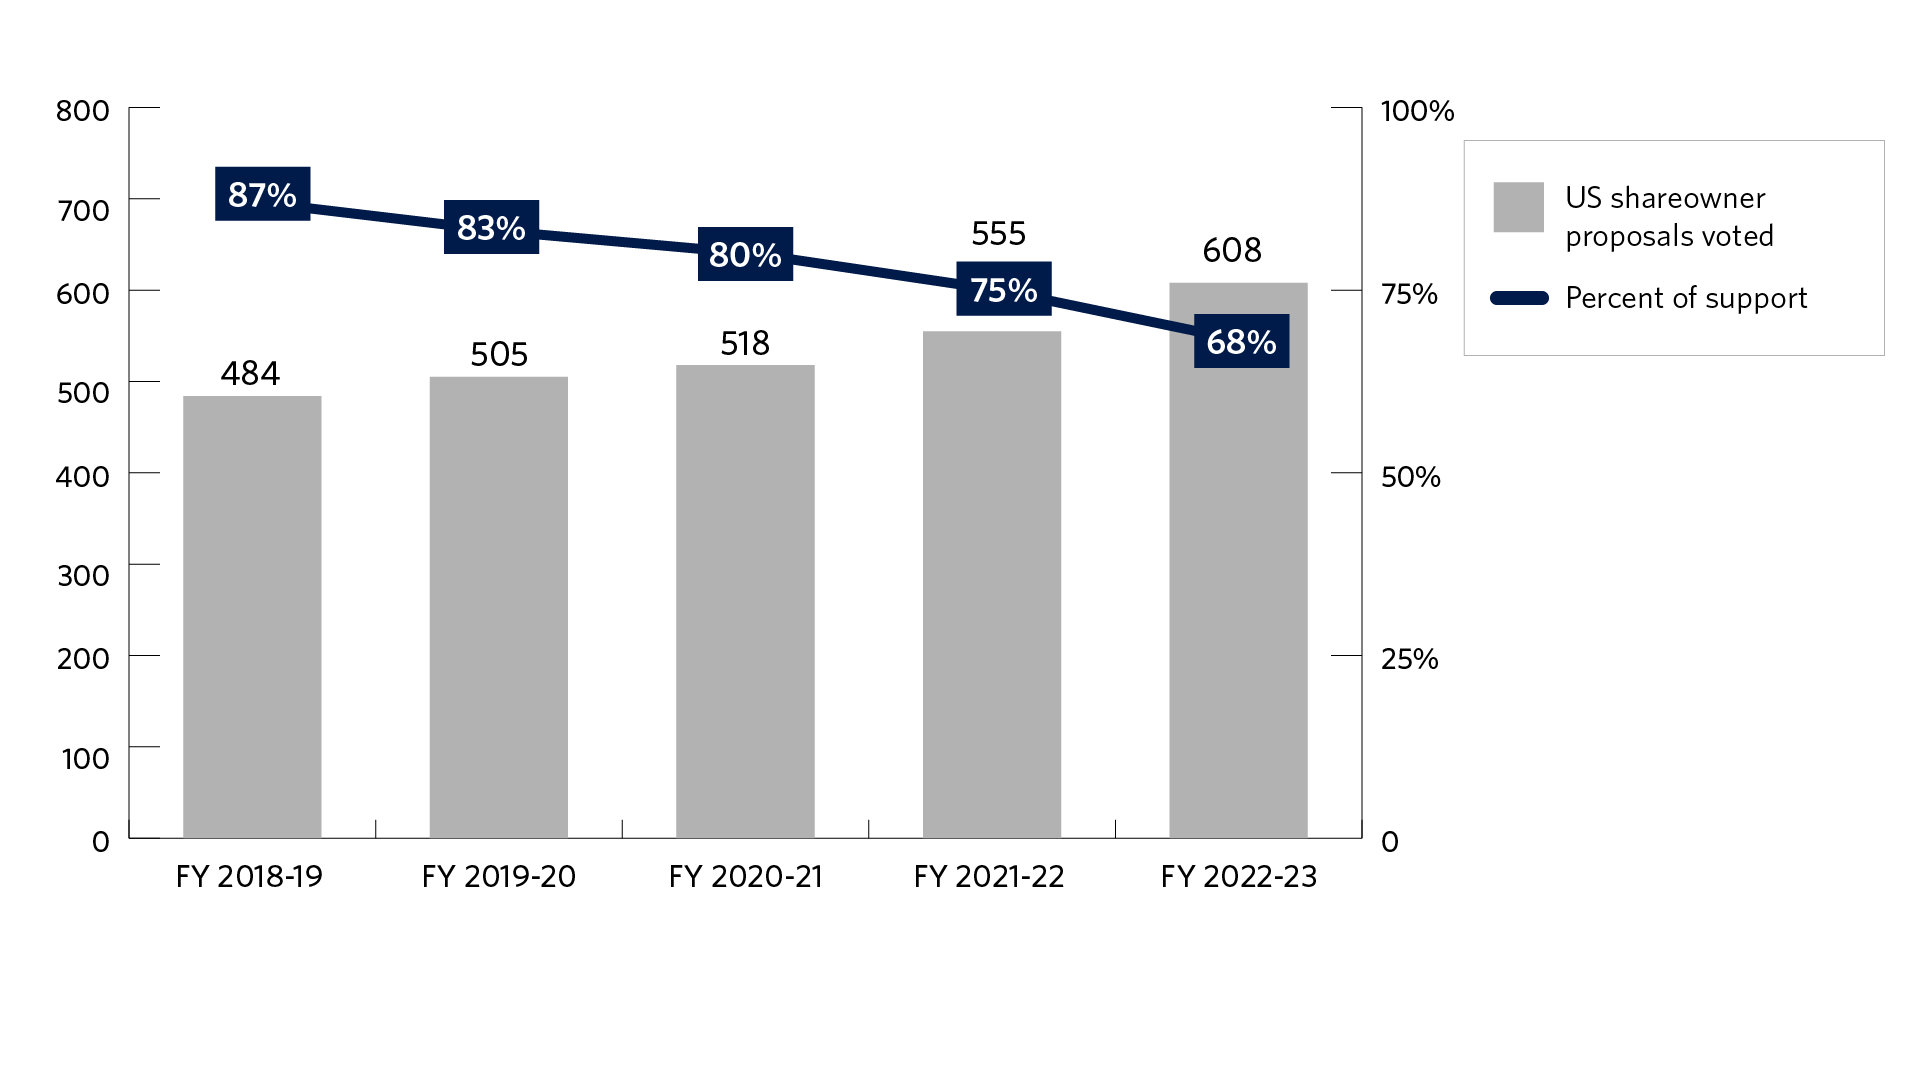
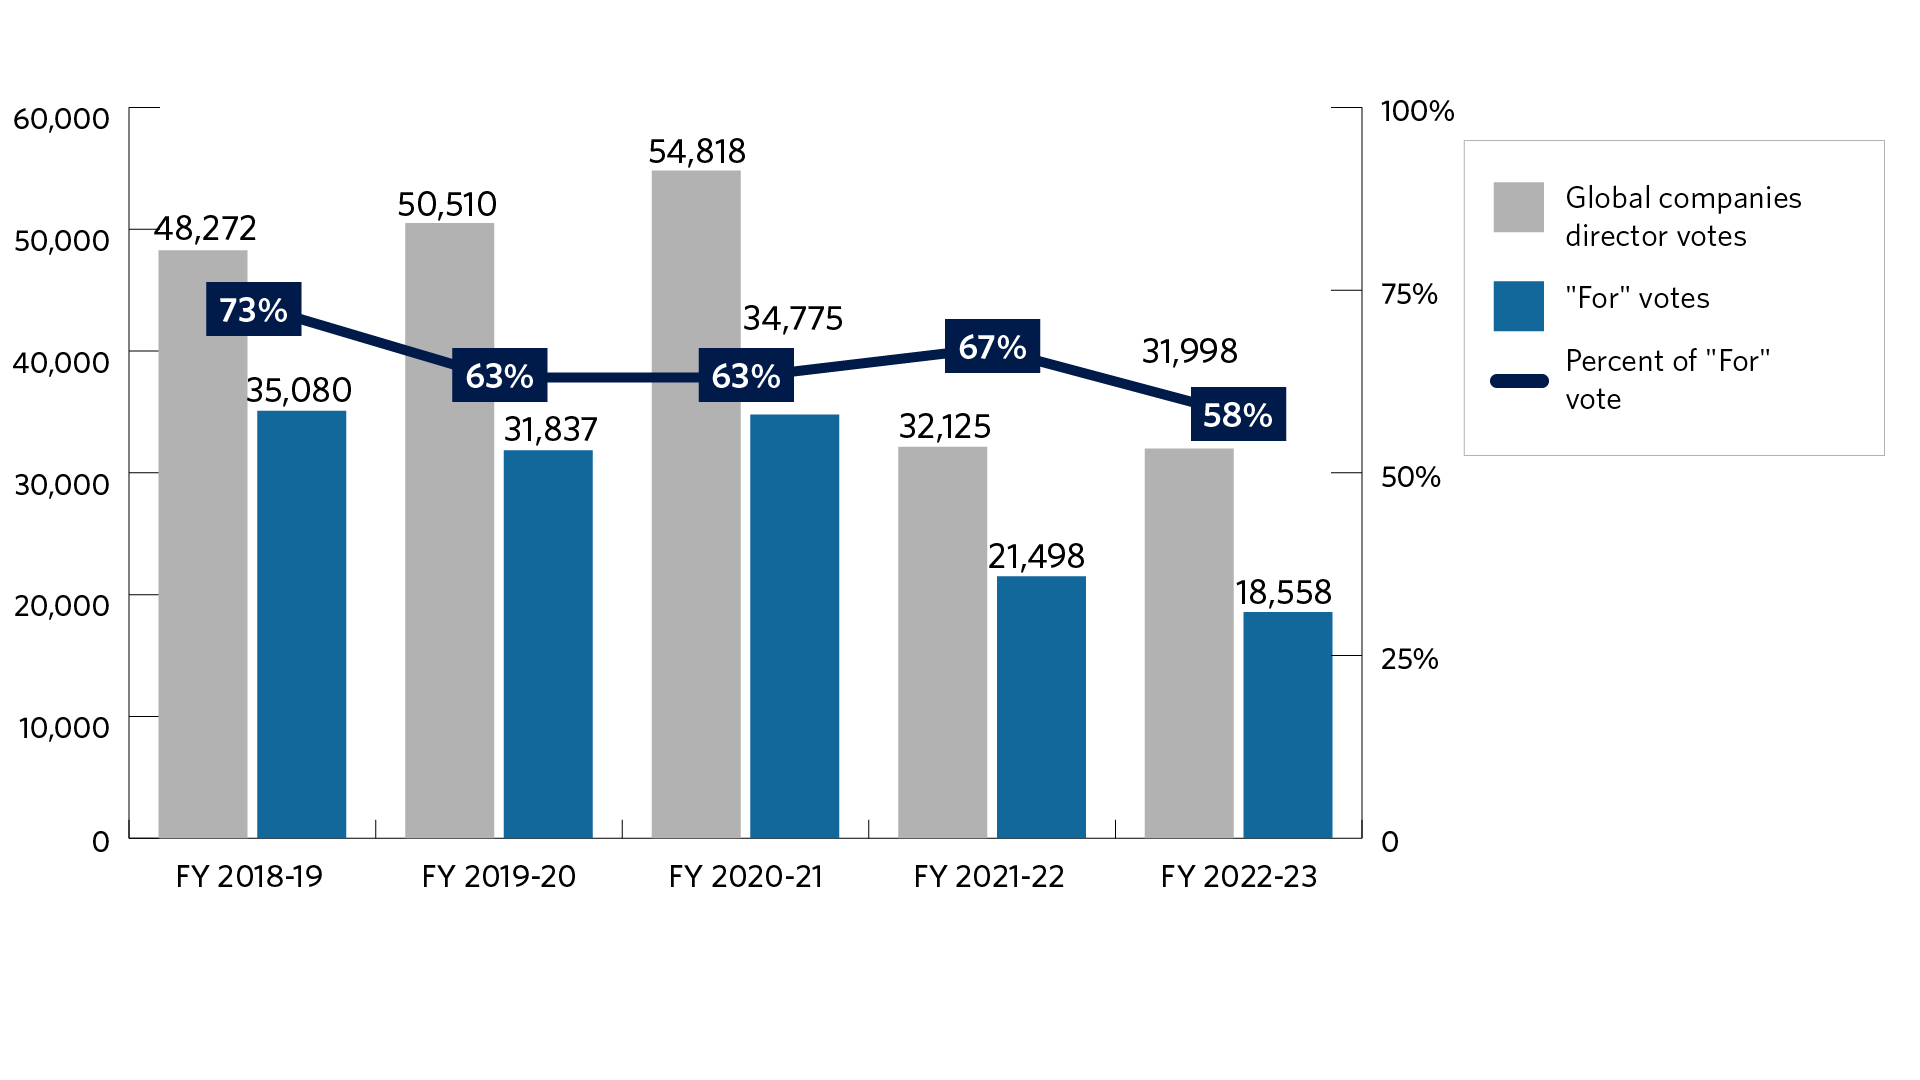
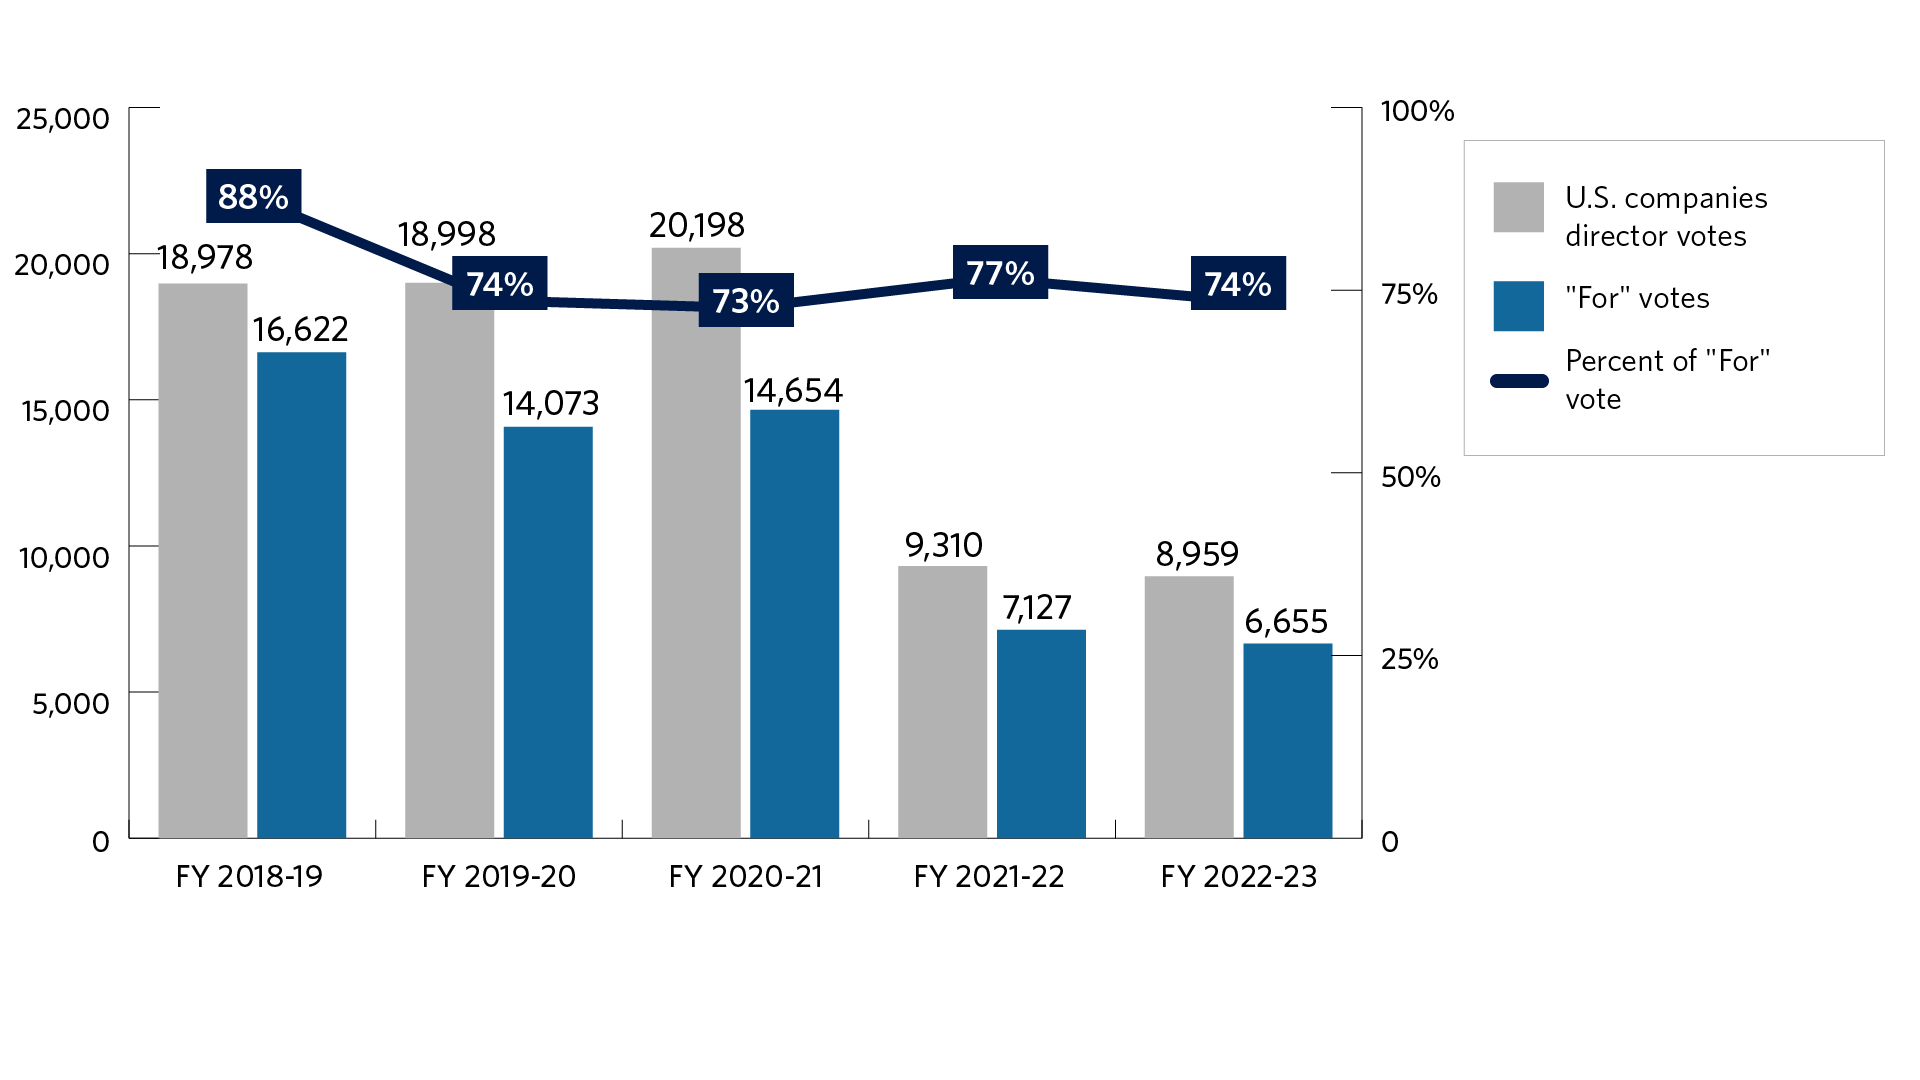
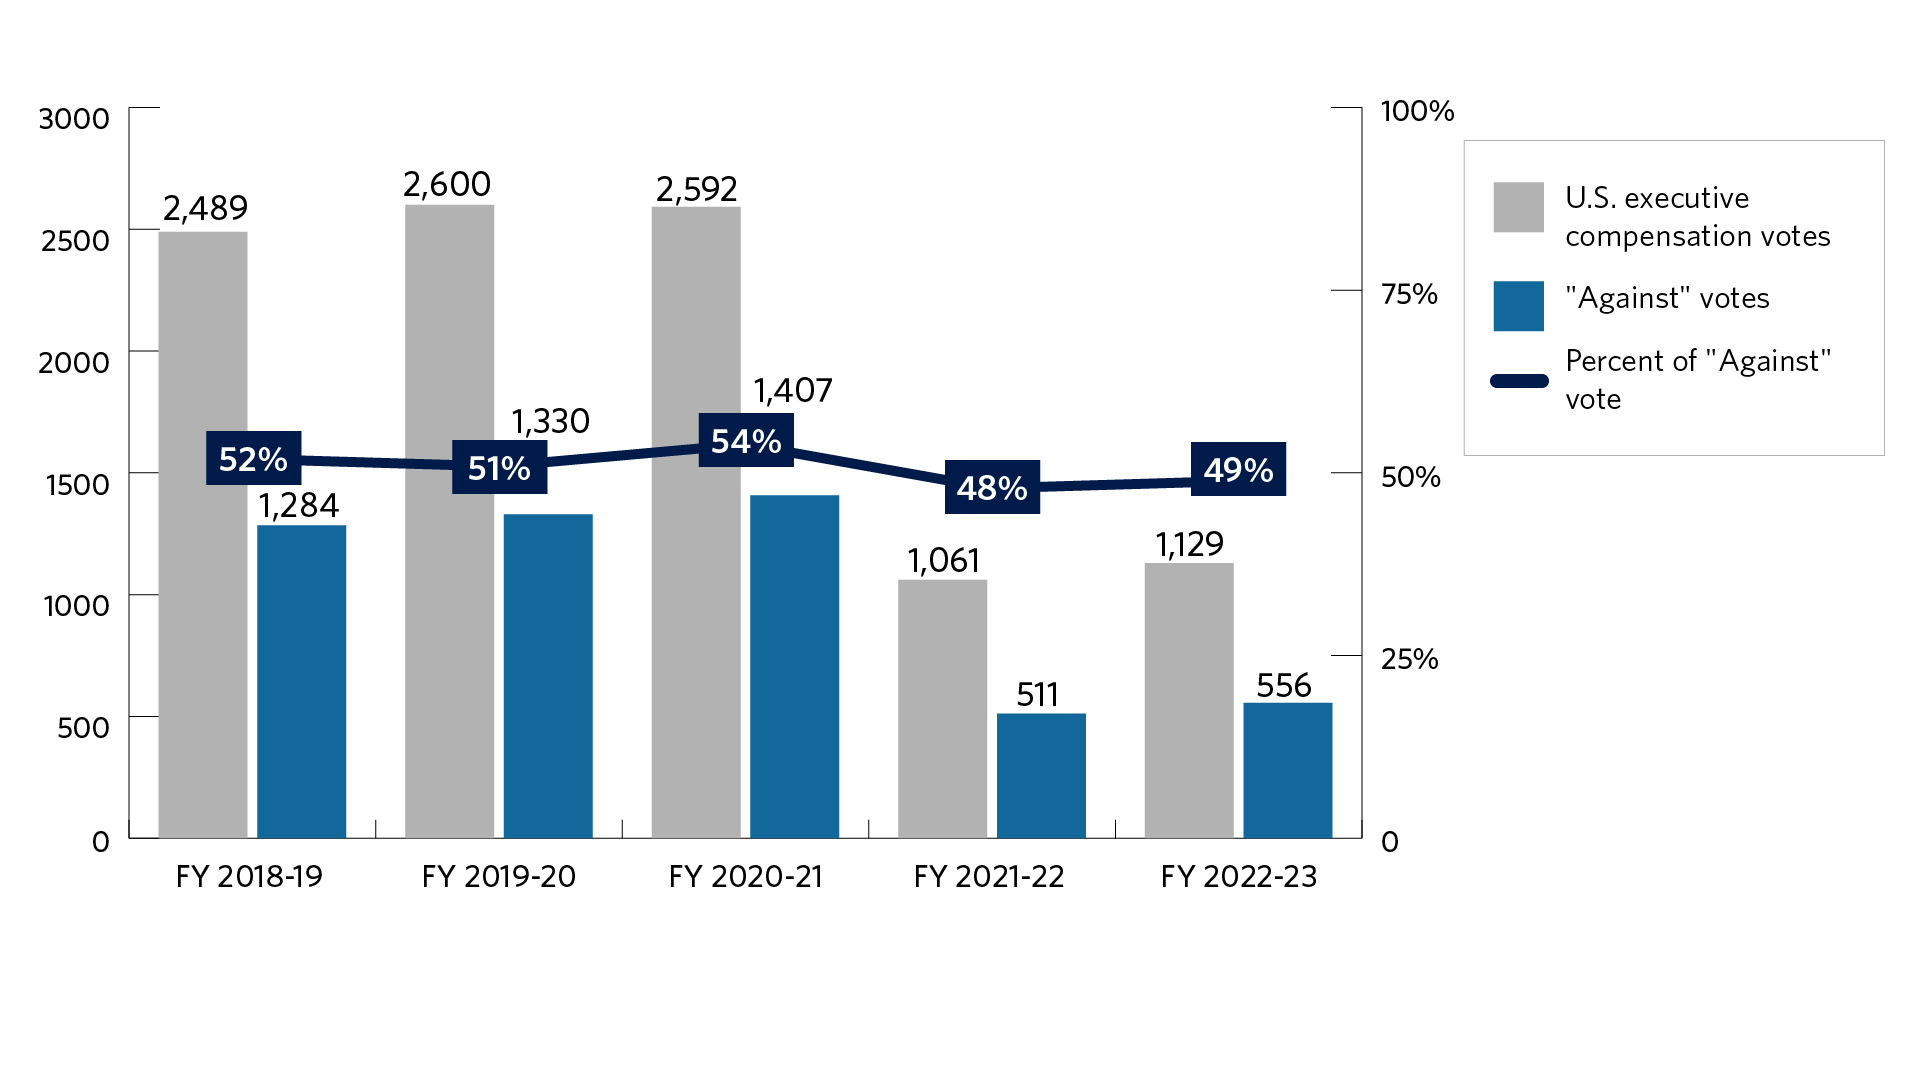
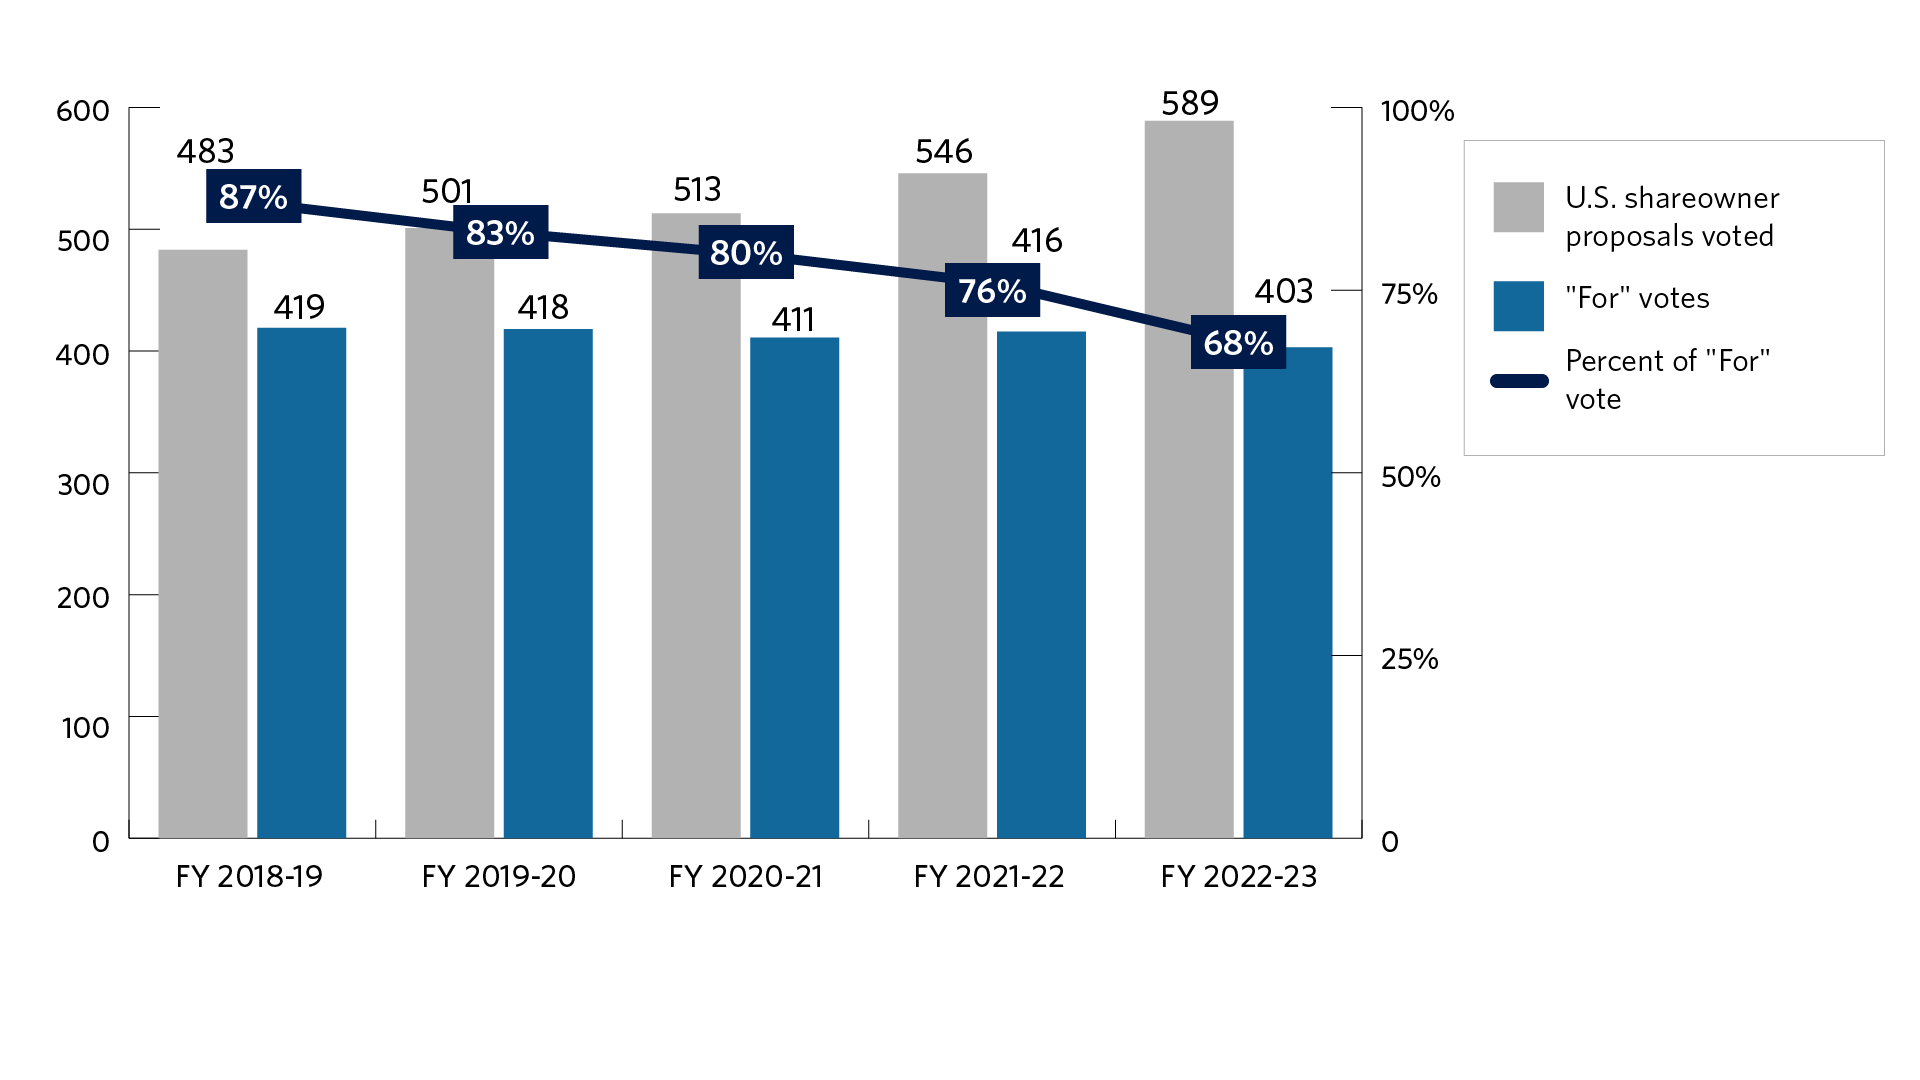
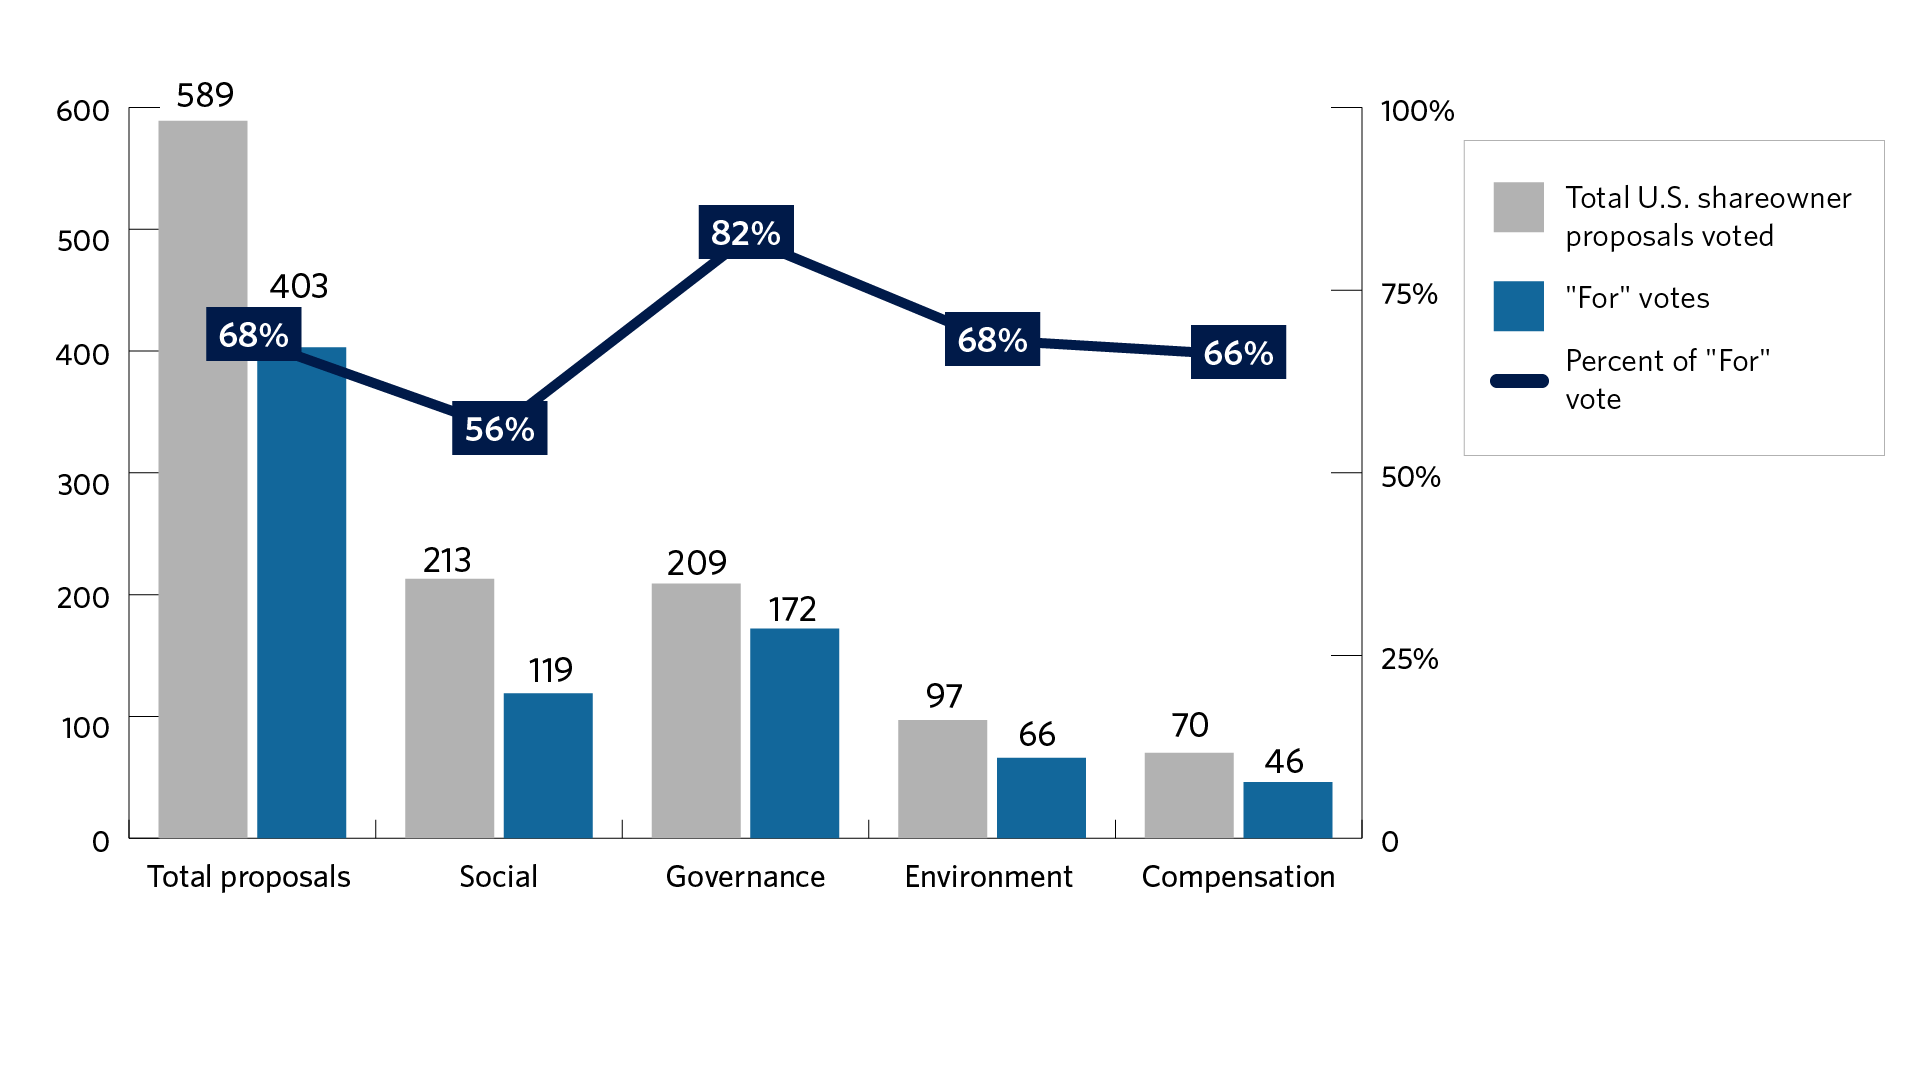
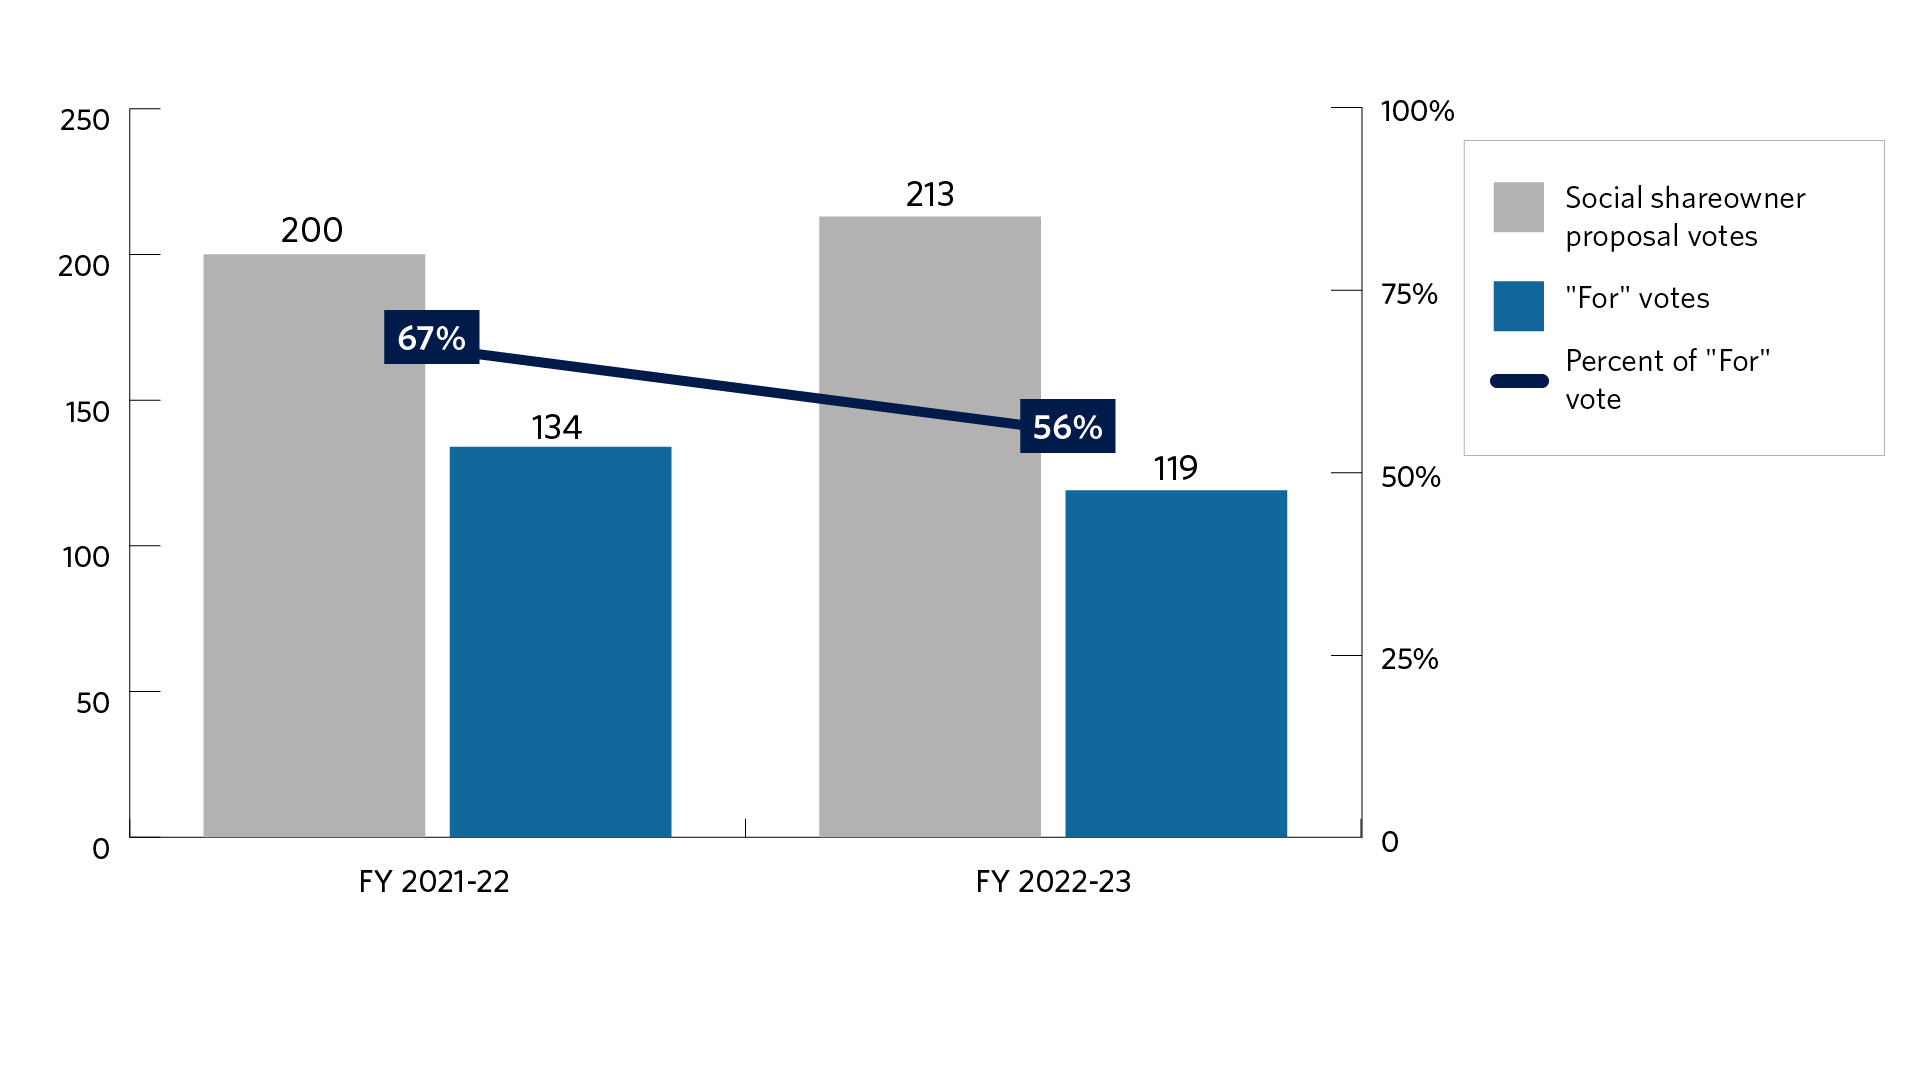
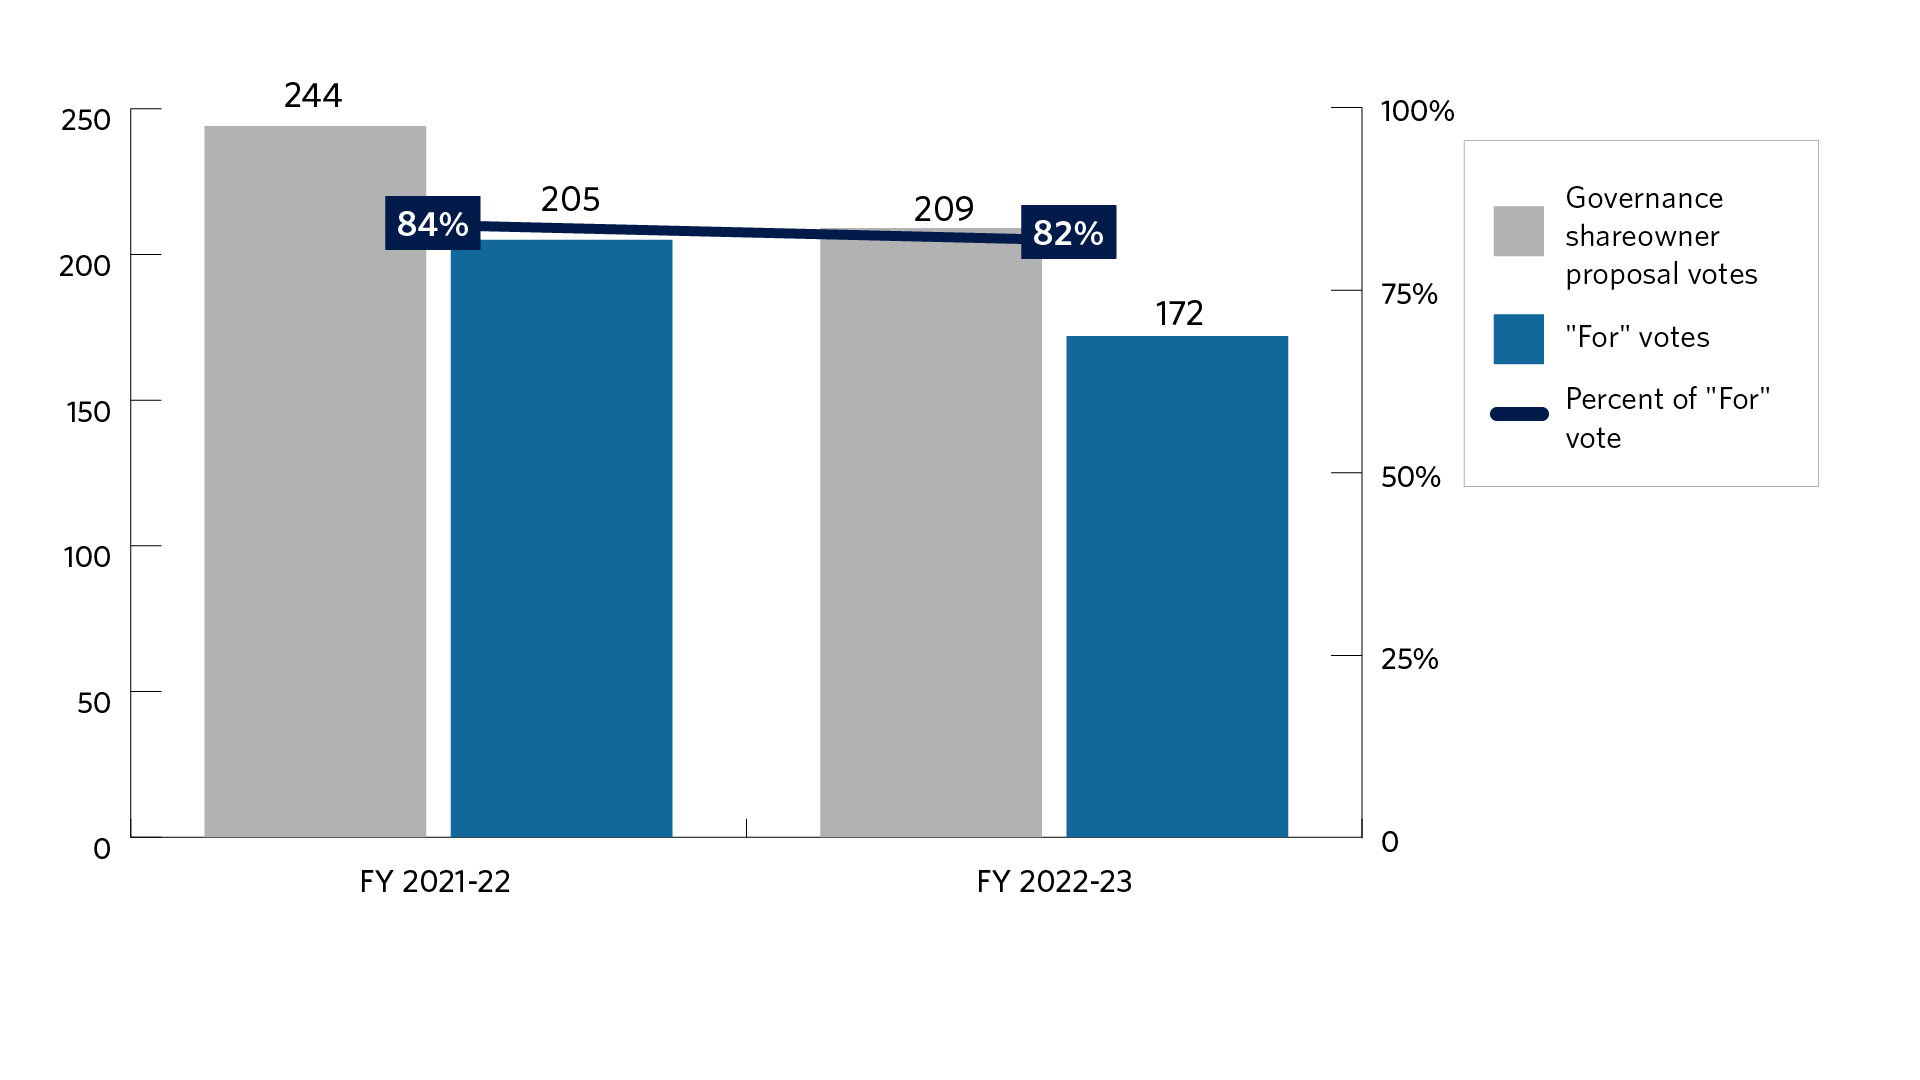
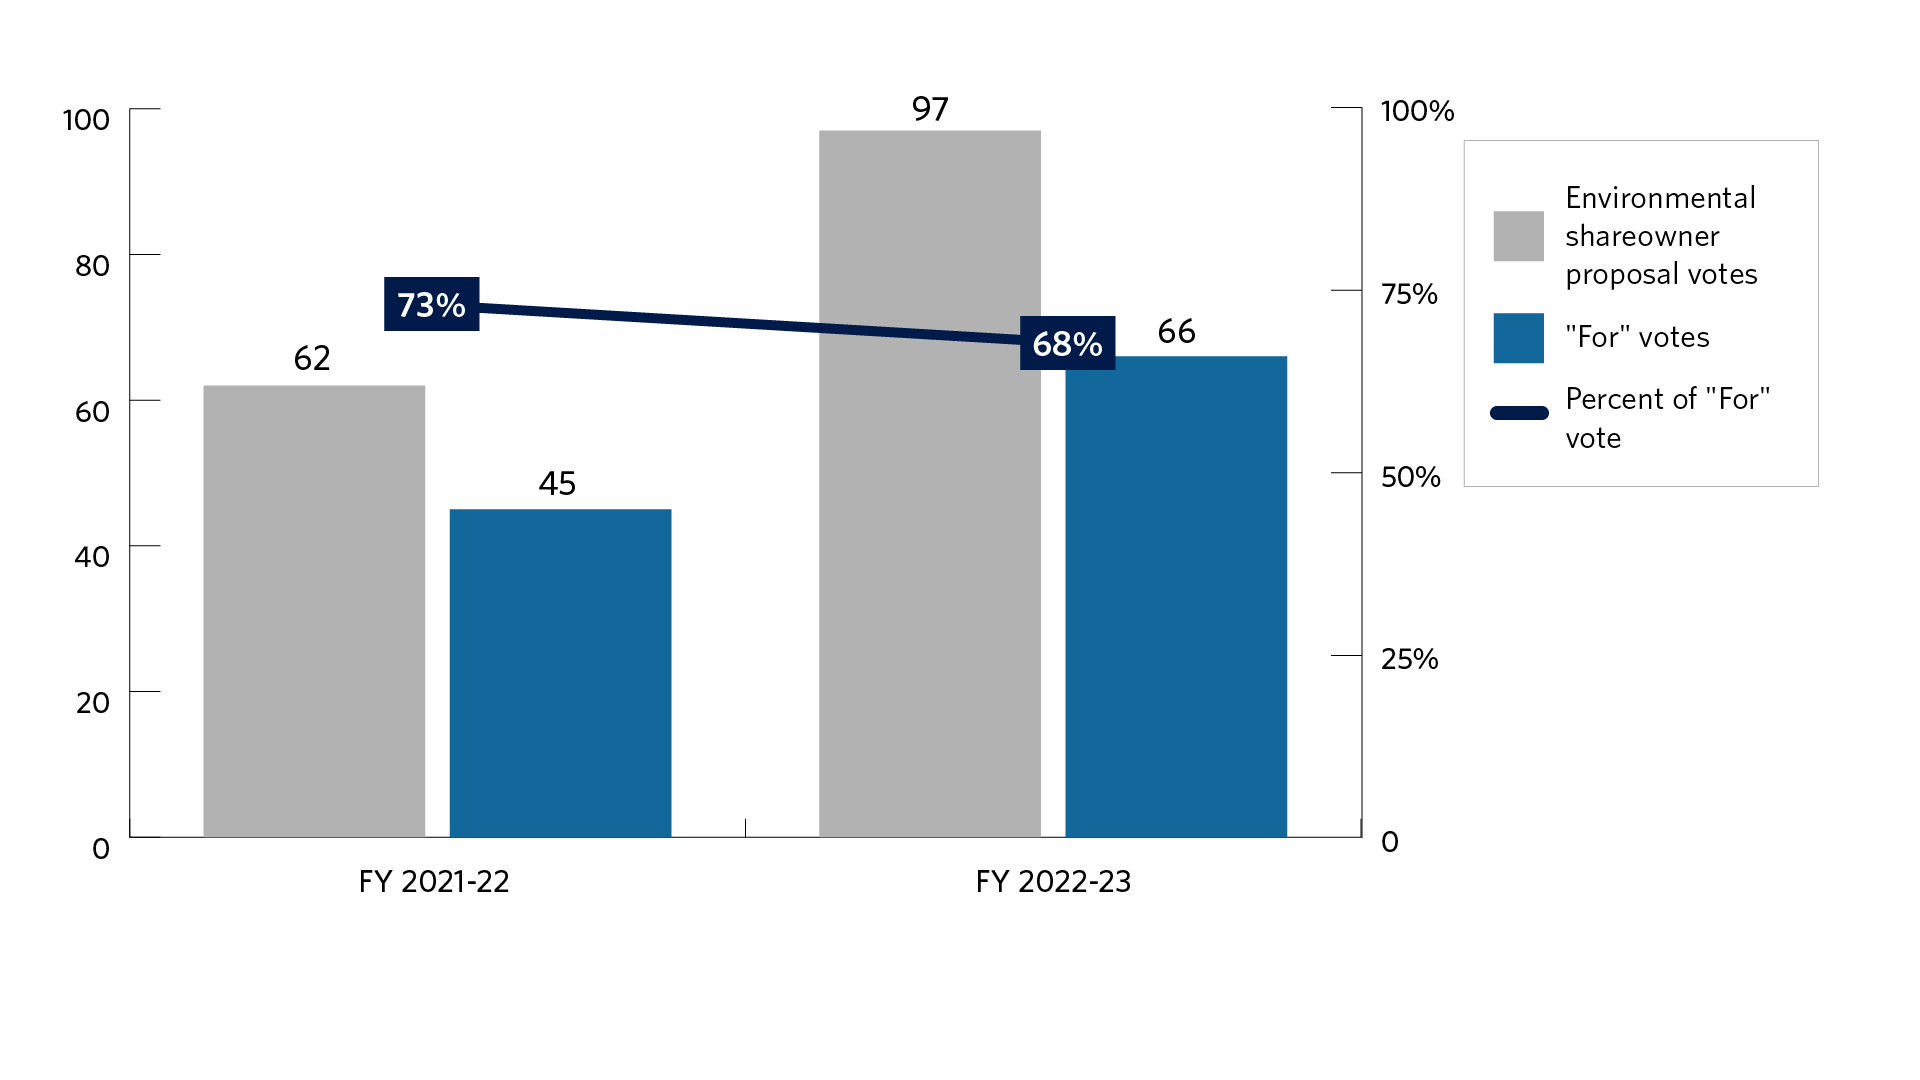
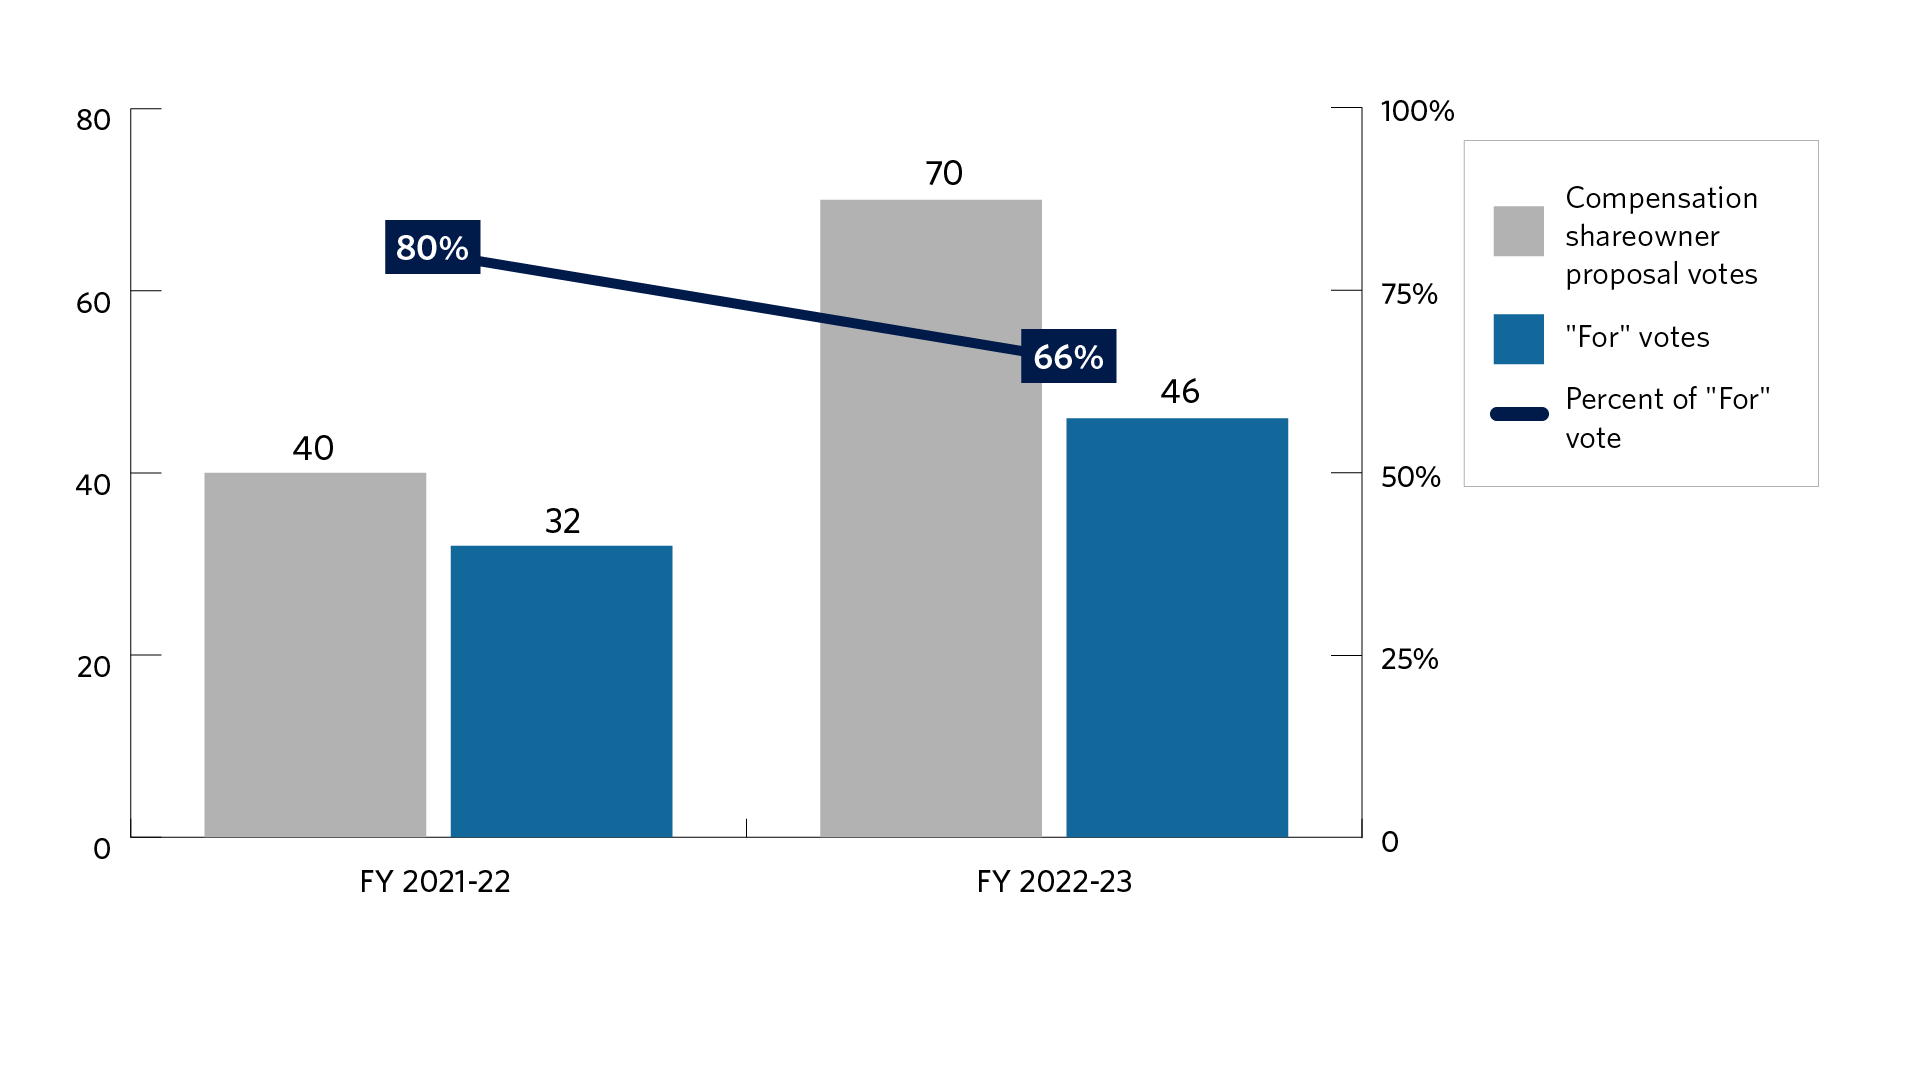
Below are our proxy voting trends over the past five fiscal years:

Figure 1: Number of Meetings Voted Globally
Bar chart of the number of meetings voted globally for fiscal years 2018-19 to 2022-23. The fiscal year starts on July 1 and ends on June 30. We voted 11,300 in fiscal year 2018-19, 14,507 in fiscal year 2019-20, 15,847 in fiscal year 2020-21, 8,679 in fiscal year 2021-22, and 9,048 in fiscal year 2022-23.
Figure 2: Number of Resolutions Voted Globally
Bar chart of the number of resolutions voted globally for fiscal years 2018-19 to 2022-23. The fiscal year starts on July 1 and ends on June 30. We voted 107,670 in fiscal year 2018-19, 134,091 in fiscal year 2019-20, 147,151 in fiscal year 2020-21, 86,016 in fiscal year 2021-22, and 88,924 in fiscal year 2022-23.
Figure 3: Global Management Proposals
Bar chart of the number of management proposals voted globally and the support level for those proposals for fiscal years 2018-19 to 2022-23. The fiscal year starts on July 1 and ends on June 30. We voted 106,673 in fiscal year 2018-19, 132,999 in fiscal year 2019-20, 146,145 in fiscal year 2020-21, 84,998 in fiscal year 2021-22, and 87,798 in fiscal year 2022-23. The support level was 78% in fiscal year 2018-19, 75% in fiscal year 2019-20, 75% in fiscal year 2020-21, 76% in fiscal year 2021-22, and 72% in fiscal 2022-23.
Figure 4: Global Shareowner Proposals
Bar chart of the number of shareowner proposals voted globally and the support level for those proposals for fiscal years 2018-19 to 2022-23. The fiscal year starts on July 1 and ends on June 30. We voted 997 in fiscal year 2018-19, 1,092 in fiscal year 2019-20, 1,006 in fiscal year 2020-21, 1,018 in fiscal year 2021-22, and 1,126 in fiscal year 2022-23. The support level was 62% in fiscal year 2018-19, 58% in fiscal year 2019-20, 52% in fiscal year 2020-21, 51% in fiscal year 2021-22, and 48% in fiscal year 2022-23.
Figure 5: United States Management Proposals
Bar chart of the number of United States management proposals voted and the support level for those proposals for fiscal years 2018-19 to 2022-23. The fiscal year starts on July 1 and ends on June 30. We voted 27,075 in fiscal year 2018-19, 27,283 in fiscal year 2019-2020, 28,750 in fiscal year 2020-21, 12,473 in fiscal year 2021-22, and 12,455 in fiscal year 2022-23. The support level was 83% in fiscal year 2018-19, 74% in fiscal year 2019-20, 72% in fiscal year 2020-21, 76% in fiscal year 2021-22, and 70% in fiscal year 2022-23.
Figure 6: United States Shareowner Proposals
Bar chart of the number of United States shareowner proposals voted and the support level for those proposals for fiscal years 2018-19 to 2022-23. The fiscal year starts on July 1 and ends on June 30. We voted 484 in fiscal year 2018-19, 505 in fiscal year 2019-20, 518 in fiscal year 2020-21, 555 in fiscal year 2021-22, and 608 in fiscal year 2022-23. The support level was 87% in fiscal year 2018-19, 83% in fiscal year 2019-20, 80% in fiscal year 2020-2021, 75% in fiscal year 2021-22, and 69% in fiscal year 2022-23.
Figure 7: International Management Proposals
Bar chart of the number of international management proposals voted and the support level for those proposals for fiscal years 2018-19 to 2022-23. The fiscal year starts on July 1 and ends on June 30 of the following year. We voted 79,598 in fiscal year 2018-19, 105,716 in fiscal year 2019-20, 117,395 in fiscal year 2020-21, 72,525 in fiscal year 2021-22, and 75,343 in fiscal year 2022-23. The support level was 77% in fiscal year 2018-19, 75% in fiscal year 2019-20, 76% in fiscal year 2020-21, 76% in fiscal year 2021-22, and 72% in fiscal year in 2022-23.
Figure 8: International Shareowner Proposals
Bar Chart of the number of international shareowner proposals voted and the support level for those proposals for fiscal years 2018-19 to 2022-23. The fiscal year starts on July 1 and ends on June 30. We voted 513 in fiscal year 2018-19, 587 in fiscal year 2019-20, 488 in fiscal year 2020-21, 463 in fiscal year 2021-22, and 518 in fiscal year 2022-23. The support level was 40% in fiscal year 2018-19, 37% in fiscal year 2019-20, 24% in fiscal year 2020-21, 22% in fiscal year 2021-22, and 25% in fiscal year 2022-23.
Figure 9: Global Director Votes
Bar chart of the number of and support level for global director votes for fiscal years 2018-19 to 2022-23. The fiscal year starts on July 1 and ends on June 30. We voted 48,272 in fiscal year 2018-19, 50,510 in fiscal year 2019-20, 54,818 in fiscal year 2020-21, 32,125 in fiscal year 2021-22, and 31,998 in fiscal year 2022-23. The support level was 73% in fiscal year 2018-19, 63% in fiscal year 2019-20, 63% in fiscal year 2020-21, 67% in fiscal year 2021-22, and 58% in fiscal year 2022-23.
Figure 10: United States Director Votes
Bar chart of the number of and support level for United States director votes for fiscal years 2018-19 to 2022-23. The fiscal year starts on July 1 and ends on June 30. We voted 18,978 in fiscal year 2018-19, 18,998 in fiscal year 2019-20, 20,198 in fiscal year 2020-21, 9,310 in fiscal year 2021-22, and 8,959 in fiscal year 2022-23. The support level was 88% in fiscal year 2018-19, 74% in fiscal year 2019-20, 73% in fiscal year 2020-21, 77% in fiscal year 2021-22, and 74% in fiscal year 2022-23.
Figure 11: United States Executive Compensation Votes
Bar chart of the number of United States executive compensation, also known as say on pay, proposals voted and the support level for those proposals for fiscal years 2018-19 to 2022-23. The fiscal year starts on July 1 and ends on June 30. We voted 2,489 in fiscal year 2018-19, 2,600 in fiscal year 2019-20, 2,592 in fiscal year 2020-21, 1,061 in fiscal year 2021-22, and 1,129 in fiscal year 2022-23. The support level was 52% in fiscal year 2018-19, 51% in fiscal year 2019-20, 54% in fiscal year 2020-21, 48% in fiscal year 2021-22, and 49% in fiscal year 2022-23.
Figure 12: United States Environmental, Social, And Governance (ESG) Shareowner Proposals (Fiscal Year 2018-2019 to Fiscal Year 2022-2023)
Bar chart of the number of United States ESG shareowner proposals voted and the support level for those proposals for fiscal years 2018-19 to 2022-23. The fiscal year starts on July 1 and ends on June 30. We voted 483 in fiscal year 2018-19, 501 in fiscal year 2019-20, 513 in fiscal year 2020-21, 546 in fiscal year 2021-22, and 589 in fiscal year 2022-23. The support level was 87% in fiscal year 2018-19, 83% in fiscal year 2019-20, 80% in fiscal year 2020-21, 76% in fiscal year 2021-22, and 68% in fiscal year 2022-23.
Figure 13: United States ESG Shareowner Proposals in Fiscal Year 2022-2023
Bar chart of the number of and support level for the United States ESG, social, governance, environment, and compensation shareholder proposals voted for in fiscal year 2022-23. The fiscal year starts July 1 and ends June 30. We voted 589 United States ESG shareowner proposals and supported 68% . We voted 213 social shareowner proposals and supported 56%. We voted 209 governance shareowner proposals and supported 82%. We voted 97 environment shareowner proposals and supported 68%. We voted 70 compensation shareowner proposals and supported 66%.
Figure 14: United States Social Shareowner Proposals (Fiscal Year 2021-2022 and Fiscal Year 2022-2023)
Bar chart of the number of United States social shareowner proposals voted and the support level for those proposals for fiscal years 2021-2 and 2022-23. The fiscal year starts on July 1 and ends on June 30. We voted 200 in fiscal year 2021-22 and 213 in fiscal year 2022-23. The support level was 67% in fiscal year 2021-22 and 56% in fiscal year 2022-23.
Figure 15: Most Common United States Social Shareowner Proposals in Fiscal Year 2022-2023
Proposal Proposals (count) Votes For (count) Votes For (percent)
Reviewing Political Spending or Lobbying 54 44 81%
Human Capital Management 30 16 45%
Racial Equity Audit 22 10 45%
Reporting on Company's Compliance with International Human Rights Standards 22 19 86%
Drug Pricing/Distribution 11 5 45%
Animal Welfare 10 4 40%
Figure 16: United States Governance Shareowner Proposals (Fiscal Year 2021-2022 and Fiscal Year 2022-2023)
Bar chart of the number of United States governance shareowner proposals voted and the support level for those proposals for fiscal years 2021-22 and 2022-23. The fiscal year starts on July 1 and ends on June 30. We voted 244 in fiscal year 2021-2022 and 209 in fiscal year 2022-2023. The support level was 84% in fiscal year 2021-2022 and 82% in fiscal year 2022-2023.
Figure 17: Most Common United States Governance Shareowner Proposals in Fiscal Year 2022-2023
Proposal Proposals (count) Votes For (count) Votes For (percent)
Independent Board Chairman/Separation of Chair and CEO 80 73 91%
Right to Call a Special Meeting 36 32 89%
Eliminating Supermajority Provisions 13 13 100%
Figure 18: United States Environment Shareowner Proposals (Fiscal Year 2021-2022 and Fiscal Year 2022-2023)
Bar chart of the number of United States environment shareowner proposals voted and the support level for those proposals for fiscal years 2021-22 and 2022-23. The fiscal year starts on July 1 and ends on June 30 of the following year. We voted 62 in fiscal year 2021-22 and 97 in fiscal year 2022-23. The support level was 73% in fiscal year 2021-22 and 68% in fiscal year 2022-23.
Figure 19: Most Common United States Environment Shareowner Proposals in Fiscal Year 2022-2023
Proposal Proposals (count) Votes For (count) Votes For (percent)
Report/Action on Climate Change 32 15 47%
Reporting and Reducing Greenhouse Gas Emissions 28 28 100%
Environmental Report 14 10 71%
Climate Lobbying 11 11 100%
Figure 20: United States Compensation Shareowner Proposals (Fiscal Year 2021-2022 and Fiscal Year 2022-2023)
Bar chart of the number of United States compensation shareowner proposals voted and the support level for those proposals for fiscal years 2021-22 and 2022-23. The fiscal year starts on July 1 and ends on June 30 of the following year. We voted 40 in fiscal year 2021-22 and 70 in fiscal year 2022-23. The support level was 80% in fiscal year 2021-2022 and 66% in fiscal year 2022-23.
Figure 21: Most Common United States Compensation Shareowner Proposals in Fiscal Year 2022-2023
Proposal Proposals (count) Votes For (count) Votes For (percent)
Regarding Golden Parachutes 38 21 55%
Race and/or Gender Pay Equity Report 10 10 100%
Restricting Executive Compensation 10 9 90%
Figure 22: Meetings by Region in Fiscal Year 2022-2023
Chart of the number of meetings by region in fiscal year 2022-23. The fiscal year starts on July 1 and ends on June 30. We voted 4,510 meetings in Asia ex-Japan, 1,125 meetings in United States, 1,066 meetings in Europe, 853 meetings in Japan, 759 meetings in Latin America, 285 meeting in Oceania, 256 meetings in MENA, 111 meetings in Canada, and 83 meetings in Africa in fiscal year 2022-2023.