CalPERS Workplace Demographics
Our team members represent a multitude of races, ethnicities, and cultural backgrounds reflective of the members we serve.
We rely on team member demographic data collected by the California State Controller’s Office to inform the organization of its workforce race, ethnicity, and gender profile. In addition, we encourage team members to participate in the Statewide Change in Disability Status Survey and Statewide Employee Veteran Survey.
There are limitations to this data. For example, team members may find that the choices available for selecting their race, ethnicity, and gender identity don’t fully align with the way they self-identify. In the coming years, we hope to pursue better ways of collecting this data, not just for CalPERS but at the statewide level. In the Looking Ahead section of this report, we explain more about our near-term plans to improve our ability to measure our DEI impact.
CalPERS Demographics For Fiscal Year 2021-22
- Eighteen race and ethnicity groups
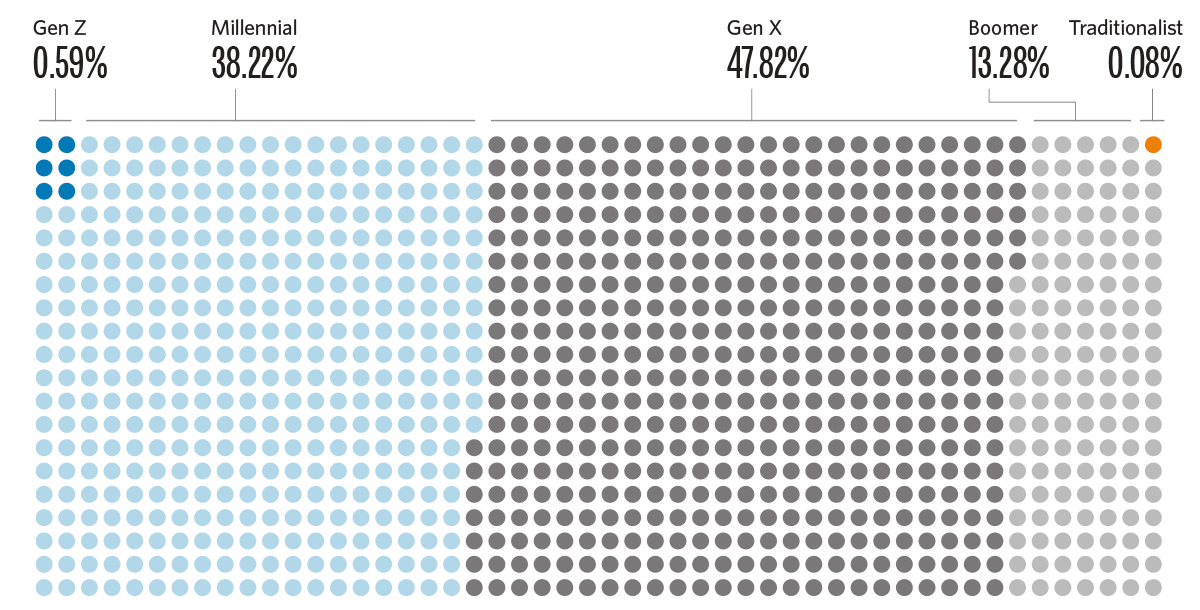
- Five generations
- Twenty-six languages
Overall Gender at CalPERS
Gender by Classification for CalPERS
| Class Group | Female | Male |
|---|---|---|
| Executive | 33.3% | 66.7% |
| Division Leader | 45.7% | 54.3% |
| Section Leader | 57.6% | 42.4% |
| Team Leader | 56.8% | 43.2% |
| Team Member | 57.3% | 42.7% |
Generational Diversity at CalPERS
Team Members with Disabilities at CalPERS
Veterans at CalPERS (FY 2021-22)
Race and Ethnicity at CalPERS
| Class Group | CalPERS Total |
|---|---|
| American Indian or Alaska Native | 0.36% |
| Black or African American | 7.73% |
| Asian-Cambodian | 0.04% |
| Chinese | 8.01% |
| Filipino | 4.40% |
| Guamanian | 0.16% |
| Hawaiian | 0.12% |
| Hispanic or Latino | 15.54% |
| Indian | 4.24% |
| Japanese | 2.06% |
| Korean | 0.56% |
| Laotian | 0.20% |
| Multiple Races (Non-Hispanic or Latino) | 3.13% |
| Other Asian or Multiple Asian | 4.64% |
| Other Pacific Islander or Multiple Pacific Islander | 1.03% |
| Vietnamese | 3.93% |
| White | 43.02% |
| Other | 0.83% |
Framework Focus Areas and Initiatives
The DEI Framework formalizes our foundational work into five key areas of focus: Culture, Talent Management, Health Equity, Supplier Diversity, and Investments. The report highlights the initiatives within each focus area and showcases our accomplishments in the fiscal year reporting period.


