Workforce Analysis
We analyzed team member separation forecasts, gaps in incumbent development, unit and position gaps, and future workforce projections from the May 2017 assessments to help determine our top workforce priorities over the next four years.
Separation Forecasting
Results
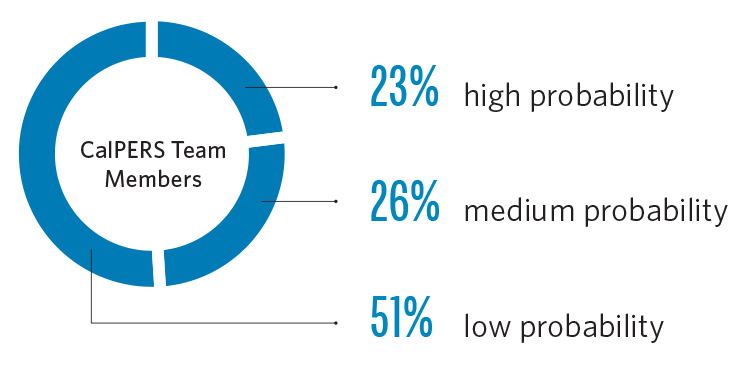
As of May 2017, 23 percent of our team members have a high probability of vacating their positions based on three factors: eligibility for retirement within 0-5 years, team members reaching their maximum salary level, and/or expressing their intentions to leave their position in the immediate future.
Figure 5: Separation Forecast for Total Workforce
High separation forecasts are broken down by the following career stages: Executive and Senior Leaders, Team Leaders, Advanced Analysts, Entry and Intermediate Analysts, and Office and Support Team.
Analysis
Executives and Senior Leaders, Team Leaders, and Advanced Analysts
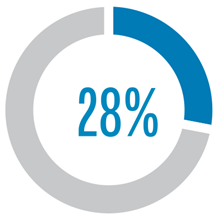
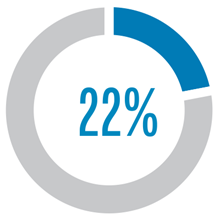
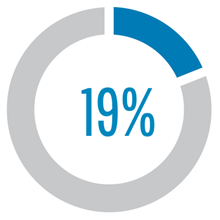
Approximately 28 percent of our executives and senior leaders (Staff Services Manager IIIs and above) have been forecasted to separate in the next 0-2 years, which highlights the importance of succession planning (see Succession Planning section on page 16). Results revealed 22 percent of team leaders (Staff Services Manager IIs and below) are forecasted for separation in the next 0-2 years, primarily due to seeking promotional opportunities or nearing retirement, which is to be expected of this group. Action steps to mitigate this risk include creating talent pipelines, developing team members, and ensuring the appropriate knowledge transfer efforts are taken. Nineteen percent of our advanced analysts (typically individual contributors who possess specialized degrees or certifications and moderate to extensive related work experience) are forecasted to separate in the next 0-2 years. This low percentage is a positive sign because this group includes some, but not all, of our hard-to-recruit positions.
Figure 6: Separation Forecast for Career Stage
Entry and Intermediate Analysts and Office and Support Staff
A high separation probablitiy is forecasted for 21 percent of entry and intermediate analysts and 35 percent of office and support staff. These numbers are expected because team members at these career stages often seek promotional and growth opportunities. CalPERS' internal movement rate (including promotions and transfers) is 60 percent and strategies to protect institutional knowledge will reduce the impact of departing team members.
Highest Number of Separations Forecasted by Area
The top three areas with the highest number of separations forecasted reside in our Customer Service and Outreach Division (CSOD) – 32 percent, Benefit Services Division (BNSD) – 24 percent, and Investment Office (INVO) – 20 percent. CSOD is the first point of contact for CalPERS employers and members, both active and retired, while BNSD provides benefits and information to members, retirees, beneficiaries, and survivors. INVO is responsible for the investment and daily management of CalPERS assets. Due to the unique nature of the work in INVO, it is recognized as a single area. The Dashboard enables each team leader to create individual action plans to mitigate potential risks associated with team members separating, such as loss of knowledge and lack of cross training and updated procedures.
Unit and Incumbent Gaps Results and Analysis
A total of 981 action plans were completed by our team leaders to address the gaps identified during the May 2017 assessments. Of those plans, 286 (48 percent) were unit gaps and 695 (23 percent) were gaps in an incumbent's development. To actively mitigate workforce gaps, team leaders used the Toolkit, which included a Solutions Guide, to complete their action plans and implement strategies and solutions. These strategies provide guidance for on-the-job training, job shadowing, and crosstraining, as well as training and development resources, and much more. Seventy-seven percent selected "no challenge" for Gaps in Incumbent Development, which supports CalPERS' ongoing commitment to training and developing our team members at every level. This percentage is in line with the Employee Engagement Survey, where we scored 59.5 percent for overall employee engagement, which is above the benchmark for those organizations surveyed by McLean & Company. Together, both stories indicate we are on the right track to increase engagement and reduce our workforce gaps.
Position Gap Results and Analysis
Team leaders identified 1,961 positions as having no gaps between the workforce of today and the needs of tomorrow, a testament to CalPERS' ongoing workforce planning efforts. Of the 1,228 gaps identified, the top Position Gaps were "Position requires a highly specialized skillset" and "No procedure guide." Since 2011, CalPERS has campaigned for knowledge transfer by promoting training, conducting risk management of our core services, and requiring knowledge transfer language in our contracts for consulting services. The continuing need to create or update procedure guides to retain institutional knowledge, develop tools to exchange technical knowledge transfer, and instill the importance of knowledge transfer across the enterprise at every level remains a key workforce planning strategy.
When surveyed, team leaders shared their top reasons for position gaps (see Figure 7). These position gaps helped drive some of our strategies. For instance, the "highly specialized skill" gap (346 responses) is connected to our recruitment strategies (Goal One), while "no procedure guide" (294 responses) is tied to protecting institutional knowledge (Goal Two).
Figure 7: Top Reasons for Position Gaps, by Number of Responses
346
Position Requires a Highly Specialized Skill
294
No Procedure Guide
237
No Career Advancement
116
No Training Plan
235
Other
Talent Trend Analysis
Our strategic goal to strengthen the long-term sustainability of the pension fund is supported in part by our fourth strategic goal to reduce complexity across the enterprise. In tandem with our workforce planning goal to increase efficiencies across the enterprise, we are implementing lean principles and aligning resources based on the greatest need through the use of active resource management through position pooling.
External Impact Analysis
Workforce demographics are changing. We are seeing fewer people entering the workforce, contributing to slow growth. The California unemployment rate is trending at 5.1 percent, while national average is 4.4 percent (U.S. Bureau of Labor Statistics, 2017). Labor markets have reached full employment, where employment trends favor job seekers, and is not projected to change in the near future. The number of people retiring each year is increasing. Retirements are growing today at three times the rate of 10 years ago. This trend is expected to continue until 2030 (Conference Board, 2016). For these reasons, our workforce planning goals will focus on improving the hiring process, implementing recruitment strategies to reach diverse applicants, and expanding the use of recruitment tools to address hard-to-recruit positions.
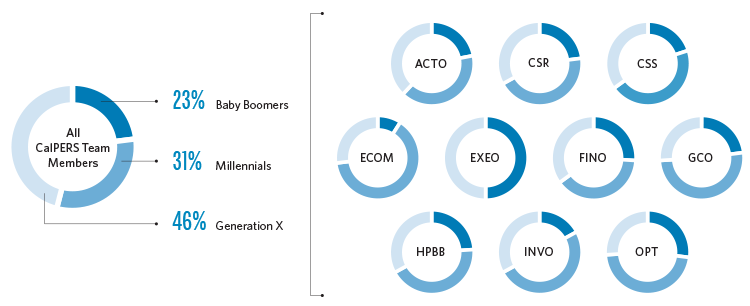
Current Team Members by Generation Group
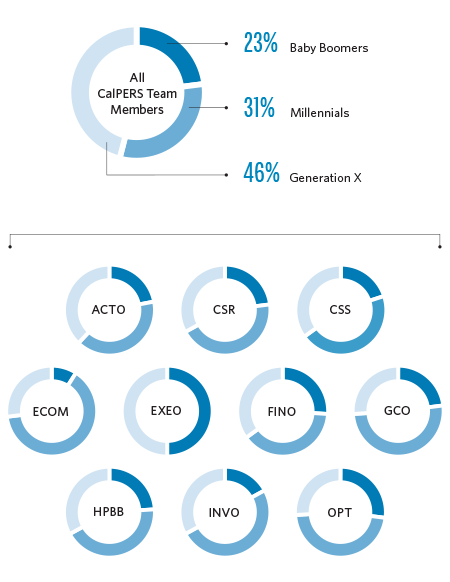
The workforce composition is changing. Currently four generations make up CalPERS' workforce: Millennials (30.65 percent), Generation X (46.08 percent), Baby Boomers (23.03 percent) and Traditionalists (.07 percent). Traditionalists are a minor representation of our workforce, therefore are not included in the graph below. Generation Z will make up 20 percent of the overall workforce by 2020 (Robert Half, 2016). As of December 2017, CalPERS appears to have a balance of each demographic across most branches.
 Source: State Controller's Office (SCO) Management Information Retrieval System (MIRS), December 7, 2017
Supply Analysis
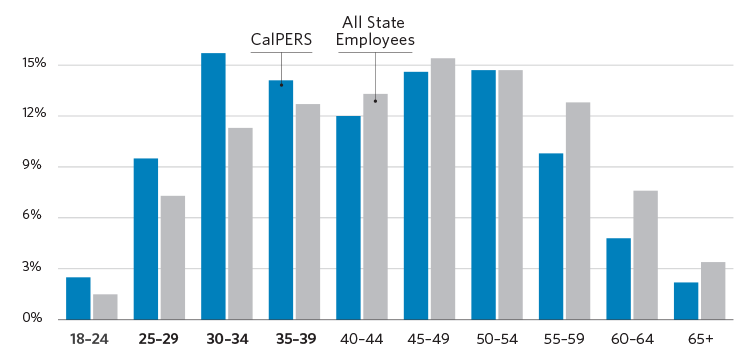
As Generation Z makes a stronger presence in the workforce, over 50 percent of team members will be under 44 years of age. This is likely to offset possible retirement trends from Baby Boomers. Our goal to expand focused recruitment strategies to attract a diverse and competent workforce is key to reaching the right talent during this demographic
 Source: SCO MIRS, December 2017
Demographics Analysis
Generation Z workers are characterized by the following attributes: connected to open source technology, are highly collaborative, mobile, data and analytics driven, and highly educated, with a high degree of autonomy, and care about making a social impact, and not specifically attached to one career. Like the private sector, the typical "government worker" is not attached to one career and they see movement as a way to build on their portfolio of skills (Deloitte, 2014). With this foresight, the importance of harnessing institutional knowledge of departing team members and increasing recruitment channels to attract a diverse and skilled workforce remains a high priority.
Retirement Projections
Results from the CalPERS' May 2016 white paper Impact on Retirement Trends, CalPERS Employee Population – Enterprise Overview validates our benchmark research by finding that by 2025:
- More than one-third of the CalPERS employee population will retire
- More than one-third of advanced analysts, managers and supervisors, office and support staff, and senior management and executives will retire
- Just under one-third of entry and intermediate analysts will retire
- Sixteen percent of employees with institutional knowledge will retire
- Ten percent of the hard-to-recruit classifications will retire
Data from the May 2017 workforce assessments produced similar retirement projection trends. These projections further support the need to protect knowledge loss, expand recruitment strategies to attract talent for hard-to-recruit positions, and balance misaligned resources across the organization.
Demand Analysis
Retirement risks, together with the demand for future roles that may not exist today, pose new workforce challenges. By 2020, the U.S. economy is expected to create 55 million new job openings, and 24 million of these will be entirely new positions (Weise, 2016). Some roles that exist today may not be required in the future, and 5.1 million jobs may be lost to disruptive labor market changes between 2015 and 2020 (World Economic Forum, 2016). State and local government jobs across the U.S. are projected to increase by 756,100, growing 4 percent by 2024. We will need to streamline our hiring process to recruit for these potential new positions that may require different skillsets, particularly in a market that is projected to favor the job seeker. Some of these future vacancies may be off-set by the federal government, which is anticipated to decrease at a rate of nearly 15 percent, or 383,400 jobs by 2024. This could impact our talent pool as staff leaving the federal government might consider state and local government for employment because of the similar pension benefits and job stability (U.S. Bureau of Labor Statistics, 2015). Below are some major industry sector changes in employment that are competing industries with CalPERS.
Figure 10: Expected Changes in Future Job Totals

