Economic Impacts of CalPERS Pensions in California, FY 2020-21
California Benefit Payment Data FY 2020-21; 2020 Economic Data
A Look Back at 2020: The Impact of CalPERS’ Pension Spending in California’s Economy During the COVID-19 Pandemic
CalPERS provides pension benefits statewide and contributes substantially to local economies. In FY 2020-21, $22.4 billion was paid in pension payments to 628,391 retirees and beneficiaries residing in California. Despite the unprecedented challenges and extreme economic uncertainty faced due to the COVID-19 pandemic, this report finds that our pension benefit payments continued to play an important role in supporting local economies and small communities.
This report provides estimates of how our retiree pension benefit payments in FY 2020-21 continued to support the California economy during the COVID-19 pandemic. More details about the methodology can be found at the end.
Pension Benefit
Retirees and beneficiaries receive pension checks
Direct Impact
Pension checks are spent to purchase local goods and services
Indirect Impact
Local businesses receive revenue, purchase supplies, and support jobs
Induced Impact
Employees spend additional income to further support local businesses and jobs
A Steady Statewide Economic Impact, Bigger Impacts Locally
An analysis in 2019 found that our pension payments generated an estimated $28 billion in statewide economic activity. Even though the COVID-19 pandemic led to major economic disruptions in California in 2020, the estimated statewide economic activity of our pension payments only slightly decreased to $27.7 billion.
Economic indicators show that between 2019 and 2020, California’s gross domestic product, or GDP, decreased roughly 2%, according to the Bureau of Economic Analysis' data embedded within IMPLAN, the software used to conduct the analysis. While some regions and industries contracted significantly, the overall impact was offset by others that showed growth. In addition, the economic infusion of the federal COVID-19 stimulus helped counter economic contractions.
Overall, the statewide impacts of our pension benefit payments held steady with a bigger impact in the smaller communities.
Pension benefits are a reliable component of California’s economy. Even when recessionary pressures rise, pension benefit spending can stimulate growth and provide several secondary benefits that support jobs.
Year in, year out, pension benefits supply a steady stream of income into the California economy.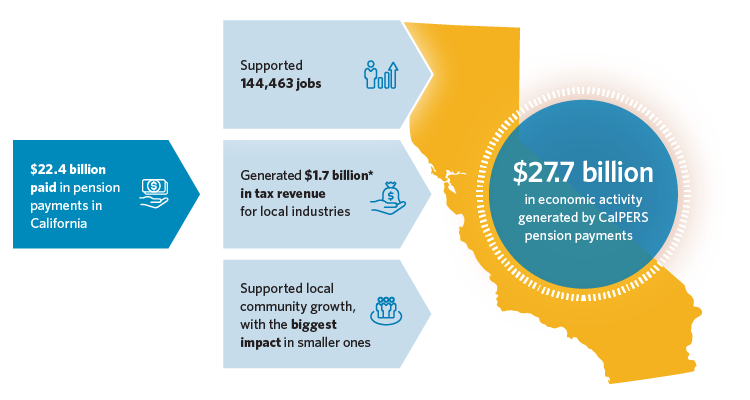
*Federal government stimulus payments to businesses and individuals influenced 2020 tax revenues in response to the COVID-19 pandemic.
California Is Home to Most CalPERS Retirees
There were 750,618 CalPERS retirees and beneficiaries as of 2020, and 83.7% of those individuals called California home compared to 84% in FY 2019-20. In FY 2020-21, we paid $27.4 billion in pension payments to all retirees and beneficiaries and $22.4 billion was paid to retirees who reside in California. The average annual pension benefit allowance for all retirees in FY 2020-21 was $39,372.
| Fiscal Year | Retirees and Beneficiaries* | Pension Benefit Payments* | ||||
|---|---|---|---|---|---|---|
| Retirees and Beneficiaries Total | Retirees and Beneficiaries in California | % of Retirees and Beneficiaries in California | Pension Benefit Payments Total | Pension Benefit Payments made in California | % of Pension Benefit Payments made in California | |
| 2020-21 | 750,618 | 628,391 | 83.7 | $27.4 billion | $22.4 billion | 81.7 |
| 2019-20 | 732,529 | 615,145 | 84.0 | $25.8 billion | $21.3 billion | 82.5 |
*Does not include retirees, beneficiaries/survivors, and payments from the Judges' Retirement System, Judges' Retirement System II, and Legislators' Retirement System.
Pension Payments Supported 144,463 Jobs
Pension benefit spending supports a variety of industries in California. When retirees and beneficiaries spend their pension benefits, they support local jobs and local businesses. Without question, the COVID-19 pandemic presented numerous economic challenges and resulted in unforeseen job losses.
Impacts by Sector — Top 5
Despite those economic declines, our pension payments generated billions of dollars in revenue across several economic sectors. Employers in the health and social services sector saw $3.55 billion in additional revenue during 2020 that can be attributed to pension payments. Those revenues also supported thousands of jobs across various industries.
| Sector* | Jobs Supported | Revenue Generated (Billions) |
|---|---|---|
| Health & social services | 28,368 | $3.55 |
| Retail trade | 20,800 | $2.48 |
| Accommodation & food services | 16,446 | $1.37 |
| Other Services** | 16,104 | $1.21 |
| Finance & insurance | 10,455 | $3.24 |
*IMPLAN uses North American Industry Classification System (NAICS) codes for industry and job sector definitions. Job sectors are multiple industries grouped together. For example, industries in the health and social services job sector include hospitals, offices of physicians, residential mental health, substance abuse, and other facilities.
**The other services sector consists of these subsectors: repair and maintenance, personal and laundry services, religious, grant making, civic, professional, and similar organizations, and private households.
$1.7 Billion in Tax Revenue Generated
Pension benefit spending generates vital revenues for state and local governments with the collection of sales and property tax.
When a retiree makes a purchase at a retail store, that purchase generates sales tax revenue for the local economy. When a retiree who owns a home or other commercial property pays the property tax bill each year, that tax payment supports the local community, including schools, parks, and road construction.
Overall, a broad economic analysis found that the potential impact of our pension payments on government tax collections rose from $1.3 billion in 2019 to $1.7 billion in 2020.
However, the use COVID-19 stimulus payments make a more exact estimate difficult to calculate. Future reports will be able to more clearly see the impact of our pension payments on taxes paid to local and state governments.
Local Economies Supported
When retirees and beneficiaries purchase goods and services, their spending generates revenue and supports the local economy.
Impacts by County — Top 5
The following five counties experienced the largest economic impact in the state from revenue generated by our pension payments. Those counties represent 43% of the total benefit recipient population and total pension payments. Since the population of these five counties also has a larger proportion of our benefit recipients, these counties also have the highest revenue generated. Los Angeles County had the largest economic impact from pension benefit spending in 2020 at $2.92 billion, revenues that helped support nearly 16,000 jobs.
| Counties | Revenue Generated (Billions) | Percent of CalPERS Benefit Recipient Population | Jobs Supported |
|---|---|---|---|
| Los Angeles | $2.92 | 13.33% | 15,978 |
| Sacramento | $2.75 | 11.10% | 15,545 |
| Orange | $1.81 | 6.56% | 9,935 |
| Riverside | $1.43 | 5.82% | 8,279 |
| San Diego | $1.43 | 6.94% | 9,204 |
A Big Impact in Small Communities
While counties with a large gross regional product (GRP) or large pension recipient population have larger absolute economic impacts from pension benefit spending, counties with smaller GRPs relative to CalPERS pension benefits tend to benefit from a greater economic impact because the payments represent a larger share of the county's overall economy. This effect is perhaps best seen by examining the weighted economic impact (WEI).
WEI measures the regional economic impact per benefit recipient relative to the GRP measured per capita. Although Los Angeles and Santa Clara counties have large GRPs, some counties with smaller GRPs, such as Riverside and Amador, have a significantly greater WEI due to the size of the population and pension payments. The weighted economic impact allows for leveled comparison of economic impact across all counties by adjusting for the GRP and population size of each county.
A high WEI indicates a larger portion of the local economy was supported by our pension benefit spending while a low WEI indicates a lesser impact on the local economy. A region that has a WEI of 0.50 indicates that for every dollar of GRP gained, half was driven by our pension benefit spending.
| County | Size of the Local Economy (GRP, Billions) | Pension Spending Impact (WEI) |
|---|---|---|
| Amador | $1.5 | 0.74 |
| Shasta | $8.0 | 0.73 |
| Butte | $9.6 | 0.73 |
| Riverside | $88.9 | 0.93 |
| Sacramento | $96.0 | 0.71 |
| San Diego | $255.6 | 0.48 |
| Orange | $263.7 | 0.59 |
| Santa Clara | $365.3 | 0.16 |
| Los Angeles | $738.0 | 0.47 |
Data and Methodology
The methodology changed for the 2022 report compared to the report issued in 2021. The methodology changes include software enhancements and data qualifications due to the COVID-19 effect on the California economy. This report used IMPLAN Online, while the 2021 report used IMPLAN Pro. The main differences between the IMPLAN Pro and Online software include revised multipliers, which are used for computing the economic impacts. These differences are documented here. For more details on the data qualifications, reference IMPLAN’s 2020 Data Release Notes.
This 2022 report reviewed California benefit payment data for FY 2020-21 and the 2020 economic data, while the 2021 report reviewed California benefit payment data for FY 2019-20 and 2019 economic data.
The data used for this study come from two sources: CalPERS retirement data and IMPLAN. The retirement data includes annual gross allowances for pension benefit recipients who resided in California as of June 30, 2021. The population examined in this study include California benefit recipients from CalPERS.
This study measures the economic impacts of our benefit payments using IMPLAN, an input-output modeling software that measures the regional or local effects given one or multiple changes in economic activity. IMPLAN is widely used by governments, universities, and public and private sector organizations to assess the economic impacts in many industry sectors.
FAQ About the Data & Methodology
No. The previous iterations of the Economic Impacts Report already incorporated the gravity model at the county and state levels. The gravity model considers the proximity between regions when estimating interregional trade flows (IMPLAN’s Gravity Model and Trade Flow RPCs).
Some data elements were decommissioned as of the 2020 Economic Impacts Report iteration, but can still be found on the CalPERS Legislative District Profile webpage.
The CalPERS Economic Impacts Report was a biennial report. This report was released on an off year to analyze the economic impacts of CalPERS pension payments during the beginning of the COVID-19 pandemic.