Economic Impacts of CalPERS Pensions in California, FY 2019-20
California Benefit Payment Data FY 2019-20; 2019 Economic Data
Providing Strength to California's Communities
CalPERS not only provides pension benefits statewide, but also contributes substantially to local economies. While COVID-19 had profound impacts to the California economy, this report didn’t review the economic changes of 2020. Instead this report analyzed the impacts of pension benefit payments of FY 2019-20 to the 2019 California economy.
As CalPERS retirees spent their monthly pension benefit payments in FY 2019–20, they generated $28 billion in economic activity that supported jobs and increased business and tax revenue. The economic impacts are significant throughout the state, and especially important in smaller communities. The $28 billion economic contribution to California's economy from CalPERS pension benefits is equivalent to each Californian receiving more than $700 a year.
Compared to our last economic impact report issued in 2019 the economic impact of pension payments in California increased by 19%, from $23.5 billion to $28 billion. Review the Economic Impacts of CalPERS Pensions in California, FY 2017-18 report.
How CalPERS Pension Benefit Spending Supports California's Economy
Pension Benefit
Retirees and beneficiaries receive pension checks
Direct Impact
Pension checks are spent to purchase local goods and services
Indirect Impact
Local businesses receive revenue, purchase supplies, and support jobs
Induced Impact
Employees spend additional income to further support local businesses and jobs
Pension benefit spending boosts local economies and provides several ancillary benefits that support jobs, generate additional tax revenue, and stimulate growth in local communities. This money provides a steady stream of income for California residents, taxpayers, and local governments regardless of the economic conditions (boom or recession).
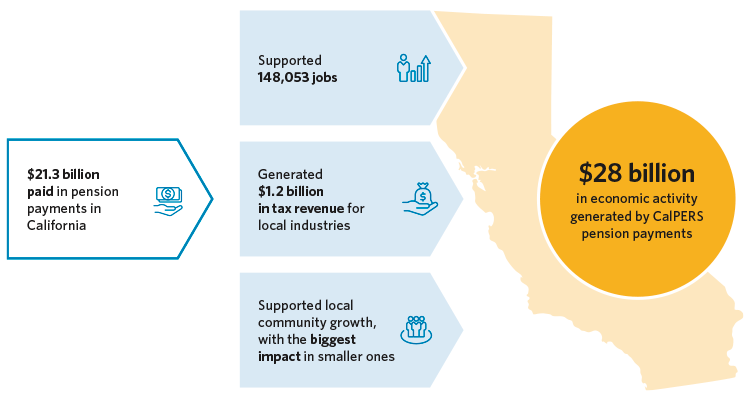
Supported 148,053 Jobs
Pension benefit spending supports many job industries throughout the state. When retirees and beneficiaries spend their pension benefit, they support local jobs in local businesses — and contribute to the economy across the state.
| Sector | Jobs Supported | Revenue Generated |
|---|---|---|
| Health & social services | 26,361 | $3.14 billion |
| Retail trade | 22,018 | $2.44 billion |
| Accommodation & food services | 21,586 | $1.77 billion |
| Miscellaneous personal services* | 15,667 | $1.29 billion |
| Finance & insurance | 9,160 | $2.90 billion |
| Transportation & warehousing | 8,352 | $1.01 billion |
| Administrative & waste services | 7,778 | $0.77 billion |
| Real estate & rental | 7,071 | $5.83 billion |
| Professional, scientific & technical services | 5,861 | $1.18 billion |
| Arts, entertainment & recreation | 5,438 | $0.56 billion |
*The Miscellaneous personal services sector consists of these subsectors: Repair and Maintenance, Personal and Laundry Services, Religious, Grant making, Civic, Professional, and Similar Organizations, and Private Households.
Generated $1.2 Billion in Tax Revenue
Pension benefit spending generates revenue for state and local governments including sales and property tax.
When a retiree makes a purchase at a retail store, that purchase generates sales tax revenue for the local economy. When a retiree who owns a home or other commercial property pays the property tax bill each year, that tax payment supports the local community, including schools, parks, and road construction.
Tax Revenue
Sales tax
$667 million
Property tax
$548 million
Supported Local Community Growth
When retirees and beneficiaries consume goods and services, their spending generates revenue and supports the local economy. Generally, counties with larger gross regional products (GRPs) and concentrations of CalPERS pension benefit recipients generate larger economic impacts. Los Angeles County had the largest economic impact from pension benefit spending at $3.28 billion. Year in, year out, pension benefits supply a steady stream of income into the California economy.
| Counties | Revenue Generated | Jobs Supported |
|---|---|---|
| Los Angeles | $3.28 billion | 17,972 |
| Sacramento | $2.69 billion | 15,654 |
| Orange | $1.74 billion | 9,697 |
| Riverside | $1.42 billion | 9,316 |
| San Diego | $1.41 billion | 8,256 |
Biggest Impact is in Smaller Communities
While counties with large GRPs have larger economic impacts from pension benefit spending, counties with smaller GRPs, relative to CalPERS pension benefits, tend to have a greater economic impact because the payments represent a larger share of the county's overall economy.
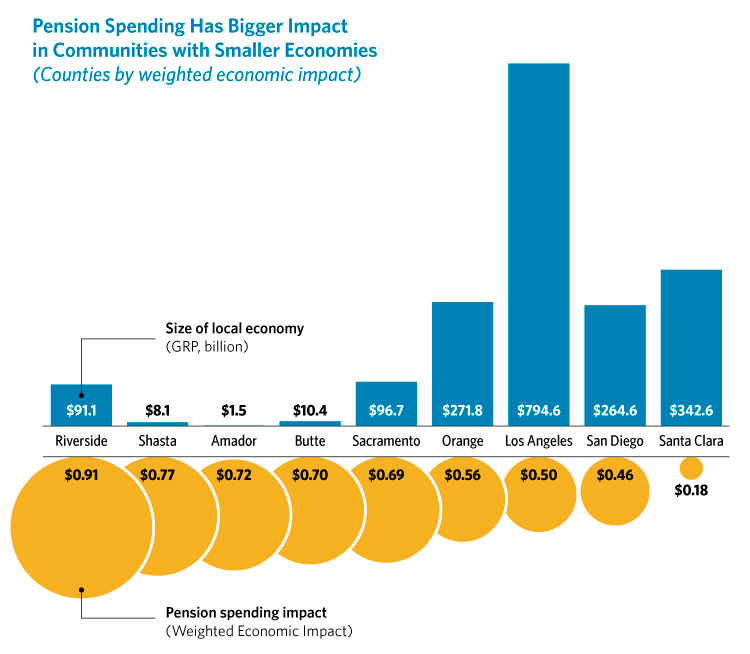
Using the weighted economic impact, this chart illustrates that although Los Angeles and San Diego counties have large GRPs, some counties with smaller GRPs, such as Riverside and Shasta counties, have a significantly greater weighted economic impact. The weighted economic impact is derived by dividing the economic impact per CalPERS benefit recipient by the GRP per capita. GRP is conceptually equivalent to the gross domestic product but on a regional economy level (e.g. state, county or district).
CalPERS by the Numbers
CalPERS is the nation's largest defined benefit public pension fund, providing retirement benefits to more than 2 million members and health benefits for 1.5 million members and their families each year.
Of the 732,529 CalPERS retirees and beneficiaries, 84% reside in California. In fiscal year 2019-20, the average pension benefit was $35,700 per year.
| All* | California* | |
|---|---|---|
| Number of retirees and beneficiaries | 732,529 | 615,145 |
| Total annual pension benefit payments | $25.8 billion | $21.3 billion |
* Does not include retirees, beneficiaries/survivors, or payments from the Judges' Retirement System, Judges' Retirement System II, or Legislators' Retirement System.

Percentage of all CalPERS retirees and beneficiaries residing in California
$35,700
Average annual pension benefit
$21.3 billion
Total pension payments in California
Who Pays for CalPERS Pensions?
The largest contribution comes from money CalPERS earns on its investments, with additional funding from employer and employee contributions. Some workers currently contribute up to 16% of their paychecks to help fund their own pensions.
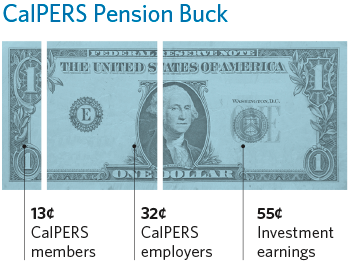
The CalPERS Pension Buck illustrates the sources of income that fund public employee pensions.
Based on data over the past 20 years ending June 30, 2020, for every dollar CalPERS pays in pensions:
- 55 cents come from investment earnings
- 32 cents come from employer contributions
- 13 cents come from employee contributions
In other words, the largest share out of every public employee pension dollar is funded by CalPERS' investment earnings.

55 cents out of every public employee pension dollar is funded by CalPERS' investment earnings
Data and Methodology
The data used for this study come from two sources: myCalPERS retirement data and IMPLAN. The retirement data include annual gross allowances for pension benefit recipients who resided in California as of June 30, 2020. The population examined in this study include California benefit recipients from the California Public Employees' Retirement System.
The economic impacts for the overall state, counties, and legislative districts were analyzed. The information on this page is a summary of statewide impacts and a few regional impacts. All results can be viewed on our Economic Impacts of Pension Benefit Payments page.
This study measures the economic impacts of CalPERS benefit payments using IMPLAN, an input-output modeling software that measures the regional or local effects given one or multiple changes in economic activity. IMPLAN is widely used by governments, universities, and public and private sector organizations to assess the economic impacts in many industry sectors.
This report also includes 93 survivor benefit records that weren’t included in the prior 2019 report with FY 2017-18 data.