
Strategic Performance
Our strategic performance is ultimately determined by our ability to achieve our goals. Each of these goals has objectives, strategic measures, and business plan initiatives aligned to them. They help us gauge our performance, while being accountable, transparent, and productive.
Strategy Map
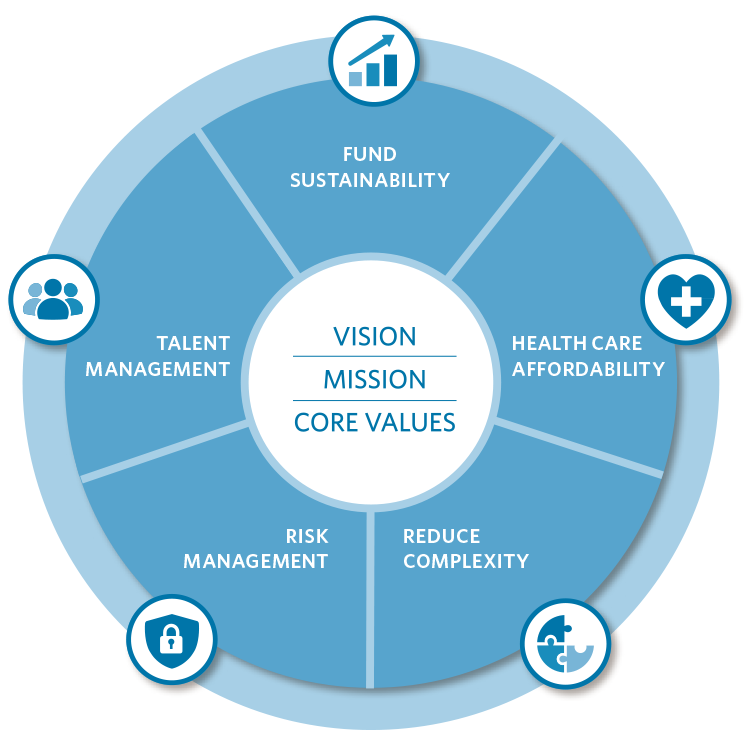
The Strategy Map illustrates our 2017-22 goals, along with our vision, mission, and core values.
Our Vision
A respected partner, providing a sustainable retirement system and health care program for those who serve California.
Our Mission
Deliver retirement and health care benefits to members and their beneficiaries.
Our Core Values
Quality | Respect | Accountability | Integrity | Openness | Balance
Figure 2: Strategy Map
Goal: Fund Sustainability

Strengthen the long-term sustainability of the pension fund.
Keeping our promise of a secure pension is the cornerstone of our mission. It has been the reason for our existence since 1932. Long-term sustainability of the pension fund and availability of the funds for our members when they retire are the embodiment of that promise we made 87 years ago.
To fulfill this promise, we strive to deliver targeted, risk-adjusted investment returns and to keep our stakeholders engaged and educated about how we balance risks and mitigations to achieve this goal.
Objectives:
Measure Summary
70.4%
Overall funded status of the PERF, up from 69.7 percent from the previous year
- We increased the overall funded status of the Public Employee Retirement Fund (PERF) from 69.7 percent as of June 30, 2018, to an estimated 70.4 percent as of June 30, 2019. Funded status is a measure of a pension system's health. Our long-term target is a funded status of 100 percent.
- We monitor the variance between actual and projected funded status of the PERF. During the previous fiscal year, we projected the funded status of June 30, 2018 to be 68.7 percent. The actual funded status was 69.7 percent, making this measure on-target. Funded status changes slowly over time, so it is important to monitor performance trends to indicate if long-term funding goals are on track.
Measure Summary
- We compare our investment volatility forecast of the total fund returns, compared to those of the prior year. Volatility is an indicator of risk. The forecast volatility was 7.7 percent, compared to 7.6 percent in the prior year. This outperformed the target of 8 percent or less.
Measure Summary
- We measure the five-year annualized total net return. The annualized five-year excess investment returns are relative to our total fund policy benchmark. This metric measures the effectiveness of achieving the objective for investment performance relative to determined targets. The PERF generated a five-year annualized total net return of 5.8 percent and underperformed the benchmark by 23 basis points, making this measure off-target. We are evaluating investment capabilities and reviewing investment activities to capitalize on our strengths.
Measure Summary
- Stakeholders scored CalPERS 5.27 out of 7 possible points, in response to the survey statement, "I understand the risks inherent in the system and I am confident CalPERS is taking steps to reduce the risks." This result shows an overall favorable increase from the previous year.
Measure Summary
- A total of 96 percent of our internal and external investment managers incorporate ESG practices into their investment processes. This exceeded the target of 80 percent or above. Asset classes are continuing to refine and evolve ESG-integration efforts, including continued sharing of best practices internally and amongst external investment managers.
Goal: Health Care Affordability

Transform health care purchasing and delivery to achieve affordability.
We aspire to transform health care purchasing and delivery, to make it affordable while providing the best value in health care to our members. We seek to understand rising health care costs and the impact of wellness on those costs.
Objectives:
Measure Summary

1.16%
Average increase in 2019 health care premiums, outperforming goal of a less than 4.97 percent increase
- Overall health care premiums for 2019 increased by an average of 1.16 percent, outperforming this year's target of maintaining less than a 4.97 percent increase.
- A total of 86.2 percent of our members stated that they received access to routine health care as soon as they needed it during 2018, a decrease of 0.4 percent from the previous year, but still within our target of 85 percent.
Measure Summary
- Of our members who are diabetic, 51.3 percent reported that they checked their blood glucose at least once a day in 2018, missing the target of 70 percent. A decreased response rate and a sampling error may have contributed to this score. We will continue to work with our health plan partners and third-party administrators to improve diabetes self-monitoring through disease management programs, member education and outreach.
- A total of 65.8 percent of members indicated that it was "usually", or "always" easy to get mental health treatment or counseling through their health plan. Access to mental health care is an issue due to stigma associated with mental health conditions, and the limited number of mental health providers in California. We will continue to work with our health plan partners to assess our current mental health services, gaps, and challenges to reduce barriers so that members can receive appropriate mental health care.
- Finally, 85.7 percent of our members rated their overall health as good, very good, or excellent in 2018. This is a 1.8 percent decrease from the previous year. We will continue to collaborate with health plans to engage at the community level to positively impact the health of members where they live.
Measure Summary
- The average dose of opioid by members was 258.53 morphine milligram equivalents in 2018. During that time, 4.84 percent of members had a long duration of use. The usage rate is much lower than the national and California averages.
- Although cesarean births can be lifesaving, far too many are performed for non-medical reasons. We measure the percent rates of in-network hospitals providing obstetric services to our members who have a specifically defined cesarean section (C-section). Our target is to have 45 percent of these hospitals meet this C-section rate of 23.9 percent or less. Data will be reported in December 2019 as part of the next fiscal year.
- The acute onset lower back pain and related opioid use and physical therapy measure will be developed during the next fiscal year.
- Lower back pain improves within the first two weeks of onset for most individuals. Reducing imaging will lower health costs and improve patient safety. Through our efforts with our partners, 84.4 percent of adults aged 18-50 with a primary diagnosis of lower back pain did not have an imaging study within 28 days of diagnosis in 2018.
Goal: Reduce Complexity

Reduce complexity across the enterprise.
We're a large organization, but large doesn't have to mean complicated. We focus on streamlining our operations, processes, and procedures. We believe this will benefit us by gains in efficiency and improve productivity among our employees. By simplifying our benefit programs, we believe we can improve service delivery, decrease costs, and reduce risk.
Objectives:
Measure Summary
- We reduced our Cost Effectiveness Measurement (CEM) Complexity Score to 59.5 while continuing to improve service. CEM Benchmarking, Inc. is a global organization who compares us to a peer network of similar pension funds.
- Our population of external investment managers is being reduced as part of our focus to lower management fees, reduce complexity, and enhance governance and manager expectations. We decreased our managers to 139, from 144 managers in the previous fiscal year. This measure met our target of decreasing five or more managers per year.
- We scored 85 for the value that information technology provides, above the CEM information technology capability score peer median of 79. Drivers of this metric include website and contact center access to member data, and data accuracy and completeness.

85
Value score our information technology provides, surpassing the peer median score of 79
Measure Summary
- The administrative cost per member rose to $211, a 2.2 percent increase. The target is an annual 2 percent decrease. This measure is off-target largely due to negotiated salary and benefit increases and a relatively flat membership. We continue to explore efforts to increase efficiencies and lower costs.
- Overhead costs for pension administration and health were at $211,033,714. This represents a 2 percent reduction when compared to the adjusted baseline.
- We measure our five-year net value-added score for investment costs compared to the targeted national peer group median. Net value added calculates the difference between a benchmark and the actual return. Our five-year net value added was on-target at 0.16 percent, exceeding the national peer median of 0.1 percent.
Goal: Risk Management

Cultivate a risk-intelligent organization.
We continue our efforts to be a risk-intelligent organization. This means protecting the data of our members and employers is paramount to us. We are keenly aware of the potential risks we face and have risk mitigation methods in place. We also work to make our compliance and audit processes more strategic based on risk and trend analysis.
Objectives:
Measure Summary

93%
Percent of our team members who are aware of our compliance program and incorporate its functions into their daily work
- A total of 93 percent of team members are aware of our compliance program and incorporate compliance functions into their daily work.
- Also, 89 percent of our team members said they are aware of our risk program and incorporate risk functions into their daily work, beating the target of 86 percent.
- Our external stakeholders rated us at 5.34 out of 7 for how well we manage compliance and risk. Our five-year goal is to achieve a score of 5.43 out of 7.
- The risk program maturity score increased from 3 to 3+ in a scale of 1 to 5. Risk maturity is defined as the degree that risk reduction processes have been formalized, implemented, and integrated into our operations.
- The compliance maturity score increased from 2+ to 3 in a scale of 1 to 5. Compliance maturity is an organization's compliance-based performance relative to Corporate Executive Board's best practice research.
Measure Summary
- We continue to advance our cyber security strategy to mitigate cybersecurity risks. This strategy is discussed during CalPERS Board of Administration closed sessions.
Goal: Talent Management

Promote a high-performing and diverse workforce.
We strive to maintain a high-performing and diverse workforce. To achieve this, we want to ensure that our employees have the resources they need to provide outstanding service to our members, business partners, stakeholders, and team. We will continue to step up our efforts to recruit and empower a broad range of talented team members to meet our organizational priorities.
Objectives:
Measure Summary
We continue to expand outreach efforts to ensure diversity of candidates. We collaborate with CalPERS Diversity Outreach Program, CalPERS Diversity & Inclusion Group, CalPERS Disability Advisory Committee, and community partnerships. Data collection points are continuing to be evaluated and created as we implement new strategies. Data will be reported in August 2020.
The following three measures share a survey score target of above 59 percent, which represents a high-performing organization:

67.7%
Score from our team members for CalPERS efforts on diversity and inclusion, exceeding industry benchmark of 59 percent for high performance
- Our team members scored us within a positive range of 67.7 percent for diversity and inclusion, fostering a culture of inclusion that welcomes diversity of thought, experience, and background.
- Team members scored accountability at 62 percent, exceeding the 59 percent target. This score reflects that we foster a culture of engagement.
- The senior and executive management relationships scored at 52 percent, which missed the target of being greater than 59 percent. Action plans were developed and implemented to help raise this score.
Measure Summary
- CalPERS competencies have been developed and communicated throughout our organization. Development is underway of an automated system designed to measure leaders' proficiency in our competencies.