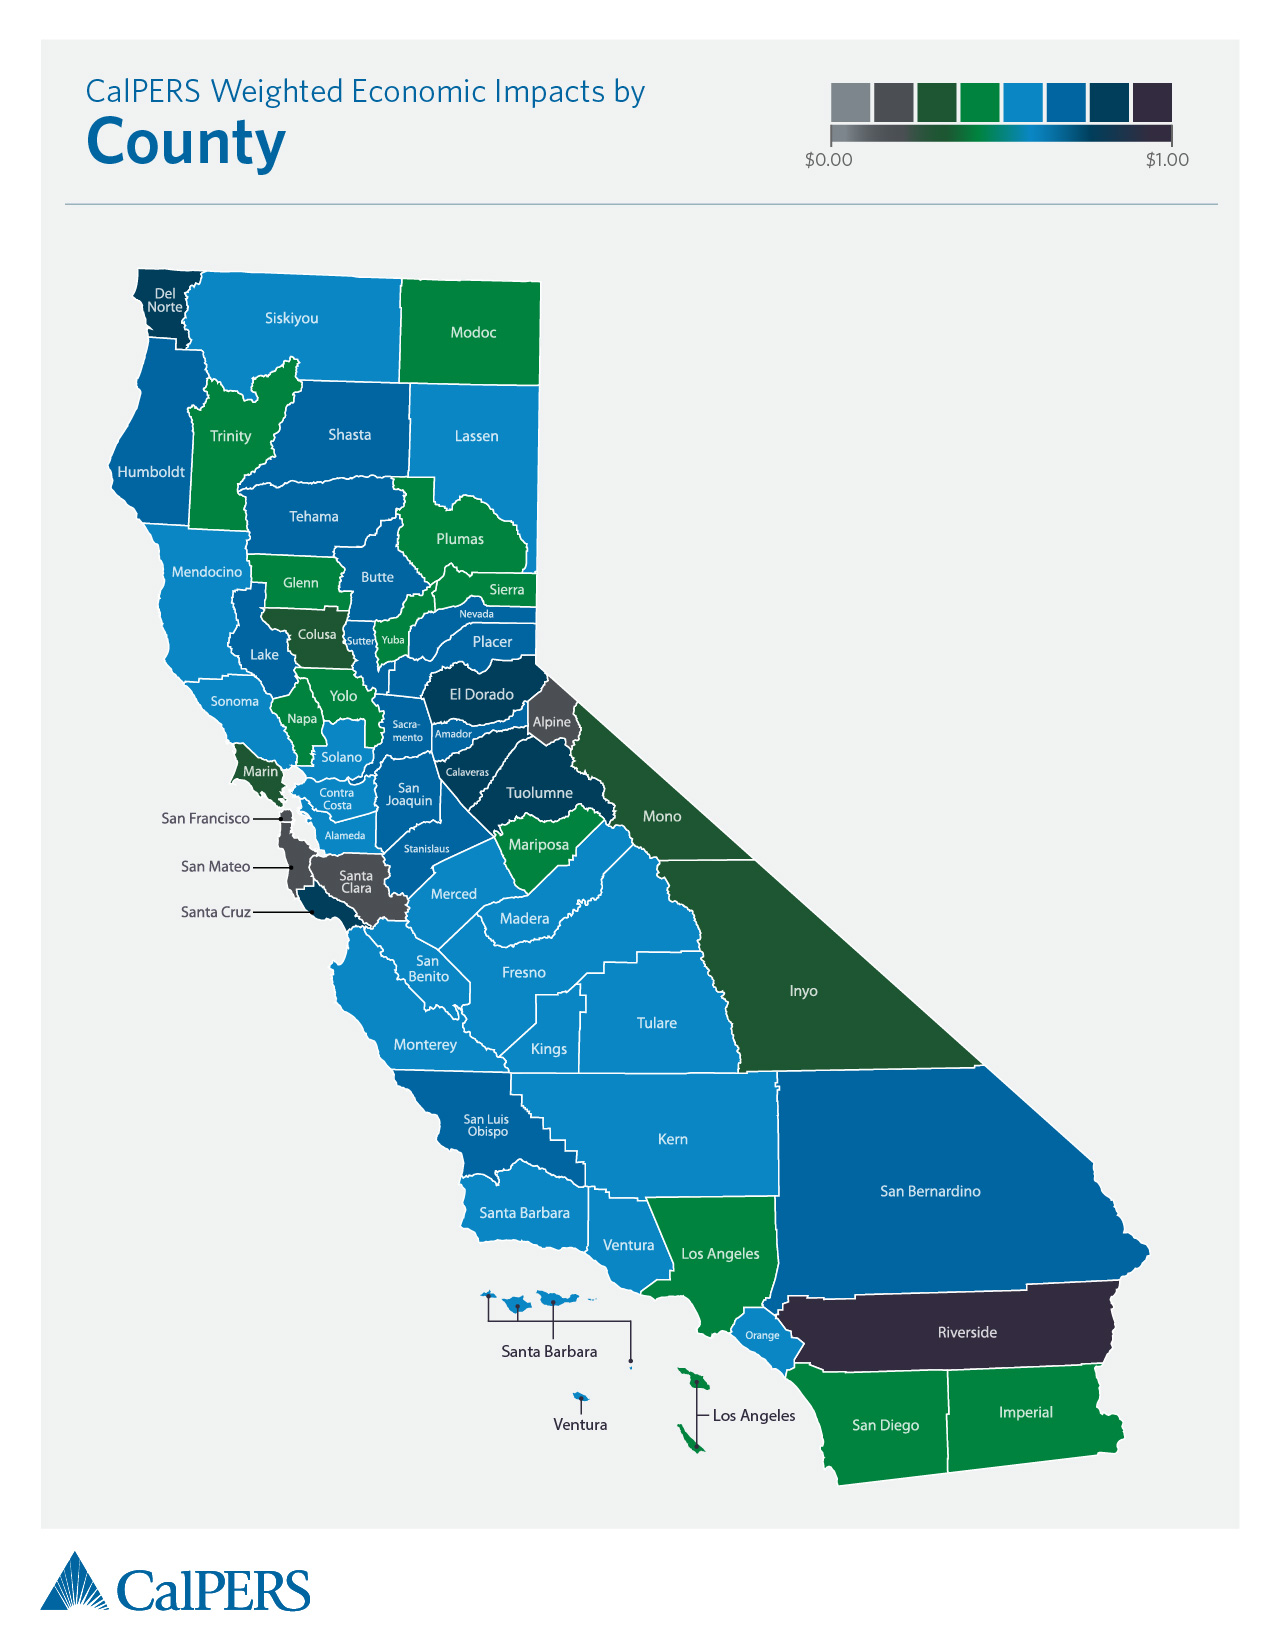
Economic Impacts of Benefit Payments
View the economic impacts of CalPERS pension benefit payments as of June 30, 2020 by California legislative districts and counties.
The maps represent the economic impacts per benefit recipient relative to Gross Regional Product per capita (weighted economic impacts). The weighted economic impacts describe how pension benefit payments affect the regional economy.
Print| County | Economic Impact | Weighted Economic Impact1 | Employment Supported |
|---|---|---|---|
| Alameda | $931,998,292 | $0.49 | 4,846 |
| Alpine | $959,329 | $0.23 | 6 |
| Amador | $69,966,632 | $0.72 | 435 |
| Butte | $258,861,154 | $0.70 | 1,569 |
| Calaveras | $42,711,110 | $0.66 | 264 |
| Colusa | $7,851,734 | $0.22 | 45 |
| Contra Costa | $654,932,820 | $0.53 | 3,492 |
| Del Norte | $36,150,772 | $0.75 | 223 |
| El Dorado | $302,489,431 | $0.74 | 1,867 |
| Fresno | $511,229,362 | $0.69 | 3,063 |
| Glenn | $15,260,659 | $0.32 | 97 |
| Humboldt | $164,571,072 | $0.66 | 1,014 |
| Imperial | $47,897,057 | $0.42 | 308 |
| Inyo | $20,799,837 | $0.33 | 126 |
| Kern | $391,279,655 | $0.59 | 2,414 |
| Kings | $87,711,235 | $0.52 | 529 |
| Lake | $42,198,875 | $0.66 | 253 |
| Lassen | $41,496,667 | $0.55 | 239 |
| Los Angeles | $3,278,554,942 | $0.50 | 17,972 |
| Madera | $103,535,685 | $0.68 | 596 |
| Marin | $114,303,648 | $0.31 | 606 |
| Mariposa | $11,894,415 | $0.37 | 71 |
| Mendocino | $60,590,169 | $0.56 | 368 |
| Merced | $81,448,479 | $0.61 | 516 |
| Modoc | $6,412,733 | $0.31 | 39 |
| Mono | $8,047,394 | $0.37 | 46 |
| Monterey | $270,335,634 | $0.56 | 1,611 |
| Napa | $142,064,594 | $0.37 | 823 |
| Nevada | $121,549,293 | $0.60 | 777 |
| Orange | $1,742,453,907 | $0.56 | 9,697 |
| Placer | $745,832,367 | $0.67 | 4,311 |
| Plumas | $14,908,498 | $0.37 | 91 |
| Riverside | $1,422,801,141 | $0.91 | 9,316 |
| Sacramento | $2,688,360,900 | $0.69 | 15,654 |
| San Benito | $24,897,025 | $0.51 | 148 |
| San Bernardino | $1,114,877,094 | $0.71 | 6,890 |
| San Diego | $1,408,672,561 | $0.46 | 8,256 |
| San Francisco | $157,480,902 | $0.13 | 644 |
| San Joaquin | $420,017,858 | $0.71 | 2,576 |
| San Luis Obispo | $469,968,467 | $0.64 | 2,953 |
| San Mateo | $239,674,715 | $0.16 | 1,126 |
| Santa Barbara | $206,040,795 | $0.49 | 1,199 |
| Santa Clara | $762,984,691 | $0.18 | 3,692 |
| Santa Cruz | $279,375,835 | $0.72 | 1,593 |
| Shasta | $272,444,272 | $0.77 | 1,721 |
| Sierra | $2,266,197 | $0.46 | 13 |
| Siskiyou | $44,107,417 | $0.47 | 288 |
| Solano | $401,044,239 | $0.51 | 2,441 |
| Sonoma | $435,726,268 | $0.56 | 2,492 |
| Stanislaus | $265,067,518 | $0.68 | 1,626 |
| Sutter | $81,547,609 | $0.75 | 525 |
| Tehama | $43,440,934 | $0.64 | 279 |
| Trinity | $10,390,300 | $0.52 | 67 |
| Tulare | $195,657,709 | $0.54 | 1,251 |
| Tuolumne | $78,012,346 | $0.68 | 485 |
| Ventura | $431,546,145 | $0.58 | 2,542 |
| Yolo | $223,543,710 | $0.46 | 1,277 |
| Yuba | $35,743,573 | $0.42 | 213 |
Footnotes
- Computed by dividing the economic impact per number of benefit recipients relative to Gross Regional Product (GRP) per capita. This value represents the
magnitude of the economic impacts generated by CalPERS pension benefit payments and describes how pension benefit payments affect a region's economy.
Note: While areas with large GRPs have larger economic impacts from pension benefit spending, areas with smaller GRPs, relative to CalPERS pension benefits, tend to have a greater economic impact because the payments represent a larger share of the area’s overall economy.