Candidate Statements
A Message From Our CEO
We're in the people business at CalPERS. At the center of all we do are the 2 million members we serve. They earned their retirement and health benefits and it's our job to ensure those benefits will be there for generations to come. Our Diversity & Inclusion (D&I) practices play an important role in delivering on that commitment.
Research shows that D&I efforts pay off — they're proven to increase productivity, creativity, and innovation while contributing to a culture of trust, respect, and accountability. It is that inclusive culture that fosters an engaged, high-performing team at CalPERS that can achieve the goals vital to serving our members.
Our D&I efforts don't stop with our internal team. Externally, they help the performance of the fund as we advocate for policies that drive success with the 11,000 companies we invest in across the globe. The more they succeed, the stronger our fund becomes. There's one more way that D&I efforts enhance the work we do: they have a positive impact on nonprofit communities throughout California through the work of CalPERS' volunteers.
In the annual Commitment to Diversity & Inclusion report, we let the data tell our D&I story by focusing on who we are, our company culture, and how it impacts the communities we serve. It's not a story of overnight success. It has taken time and a series of foundation-building steps to get where we are today.
While the story continues to unfold, one thing will stay the same: D&I will remain an integral part of our long-term business strategy to meet members' needs.
Marcie Frost
Chief Executive Officer
We Are a Diverse & Inclusive Workforce
Our team has grown more diverse over the years, in part reflecting the state of California, but also due to our efforts in seeking out qualified candidates — wherever and whomever they may be. These efforts have paid dividends in providing us with a team that offers myriad viewpoints and experiences.
Here is a look at how we've evolved in our ethnic diversity:
Ethnic Diversity at CalPERS Over the Last 3 Years
| Ethnicity | 2016-17 | 2017-18 | 2018-19 |
|---|---|---|---|
| White | 45.10% | 44.75% | 43.12% |
| Asian | 27.30% | 22.38% | 22.88% |
| Hispanic | 14.30% | 15.37% | 15.87% |
| African-American | 9.00% | 9.09% | 8.60% |
| Filipino* | — | 4.74% | 4.41% |
| Pacific Islander | 0.90% | 0.97% | 0.98% |
| Native American | 0.30% | 0.36% | 0.36% |
| Other | 2.50% | 2.73% | 3.11% |
| Unknown | 0.60% | 0.55% | 0.65% |
| Two or more | — | 0.07% | 0.03% |
Source: State Controller's Office
*Filipino not reported as a separate category for 2016-17
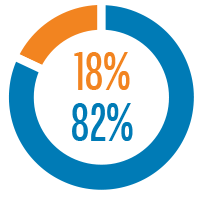
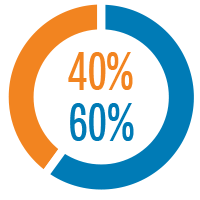
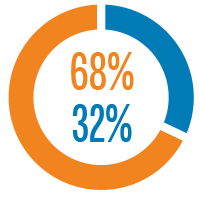
Gender diversity also has evolved in all levels of our organization over the last three years.
Gender Diversity at CalPERS Over the Last 3 Years
2016-17
2017-18
2018-19

Current Gender Diversity in Our Leadership
Executive Team
Senior Leaders
Team Leaders
Our diversity isn't limited to ethnicity and gender. We're four generations of public employees working together. While generationally we embrace different values, we all share a commitment to public service and to our members.
Generational Diversity at CalPERS Over the Last 3 Years
| Generation | 2016-17 | 2017-18 | 2018-19 |
|---|---|---|---|
| Traditionalists | 0.07% | 0.07% | 0.07% |
| Baby Boomers | 23.20% | 21.48% | 19.08% |
| Generation X | 46.10% | 46.19% | 46.63% |
| Millennials | 30.63% | 32.26% | 34.22% |
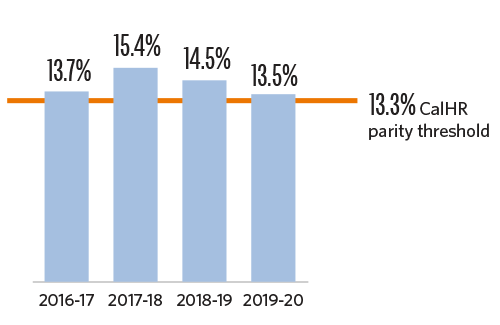
Approximately 390 team members, or 14.5%, self-identified as persons with disabilities, which is above the 13.3% parity threshold set by the California Department of Human Resources (CalHR).
In fact, we've exceeded this threshold every year for the past three years, as the chart below demonstrates.
Percentage of Team Members With Disabilities
Our team members are bilingual — 89 team members volunteer their interpreting and translating services in 27 different languages. We take great care to ensure we can communicate with our customers by employing our bilingual team members at contact points.
Our Behavior Influences Our Culture

We invest in our team members and commit to diversity and inclusion in our workplace by putting real resources behind what we do — and we get personally involved.
Exposure to New Experiences
To enrich our work environment, we provide team members with an array of resources that support networking and mentoring. These include employee resource groups (ERGs), educational and training resources, and leaders who support a mentoring culture.
We hosted 25 D&I events that covered topics such as disability awareness, domestic violence prevention, LGBTQ+, mental health, and emergency management. Highlights include:
- Our 12th Annual Diversity & Inclusion Day, an event dedicated to showcasing the many cultures that make up our community at CalPERS, as well as the community we serve
- Attitude of Gratitude, an event that featured our CEO and board president openly sharing their thoughts on how to cultivate an attitude of gratitude in the workplace
In addition, we hosted quarterly lunchtime "brown bag" sessions featuring senior leaders, an idea inspired by feedback from our 2017 Employee Engagement Survey as well as insights gained through focus groups. Each session was open to all CalPERS team members and provided a unique mentoring opportunity as attendees connected with senior leaders.
We Invest in Training & Development
We facilitated 41 D&I workshops and training classes, totaling 60 combined hours on topics including mental health, LGBTQ+ and gender identity issues, unconscious bias, communication styles, inclusive leadership, generational awareness, new employee onboarding, and more.
Leaders set the tone for our organization, so we're intentional in educating them on the importance of diversity and inclusion within the workplace. We incentivize our leaders by giving them continuing education credits for the hours they spend attending workshops and events related to diversity and inclusion. Collectively, leaders received 429 hours of credit attending this type of training in 2018-19.
We invest in our future leaders through informal mentoring, speed mentoring, and our award-winning Emerging Leader Program.
- Informal mentoring builds upon the existing strengths throughout the enterprise by developing new relationships and sharing ideas and knowledge.
- Speed mentoring events allow team members to network with multiple mentors and exchange information.
- Our Emerging Leader Program is open to 25 analysts on an annual basis. It bridges the learning and experience gap to first-line leadership classifications through classroom training, experiential learning, self-reflection, teamwork, and mentoring.
Accessibility Matters
We create digital content that is accessible to everyone, regardless of physical disabilities.
This year, we established a multi-disciplinary Accessibility Compliance Team (ACT) to support the enterprise in achieving compliance with federal accessibility laws. We also developed and launched five new courses on accessibility and conducted drop-in sessions, supporting 227 content creators in creating accessible documents.
Raising awareness of the need for accessibility is one of the goals of ACT. On May 16, the team recognized Global Accessibility Awareness Day with demonstrations of accessibility testing, document remediation, assistive technology, and accessibility awareness.
Outside of CalPERS, ACT also serves as a leading resource to an interagency government forum known as the Web Accessibility Community of Practice, in which we collaborate with other state agencies and share information on accessibility and compliance.
Our efforts in accessibility go beyond compliance. Internally, we believe an accessible workplace provides equitable opportunities for our team members and those looking for career opportunities here. Externally, it makes our materials and services easier to use for members, providing them a better overall customer service experience.
We Value Employee Engagement
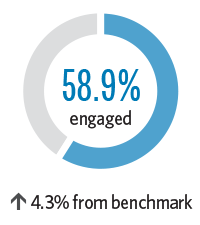
We know that engagement drives innovation and creativity, so we formally measure our team's engagement levels on an annual basis through an engagement survey.
Results of the survey show our team is engaged — we scored higher than the benchmark of 54.6% set by our survey provider. Our score revealed that 58.9% of us are engaged, feeling energized and passionate about our work, and consistently exceeding expectations. And a promising 21.9% of us are nearly engaged — which are the team members we focus our engagement efforts toward.
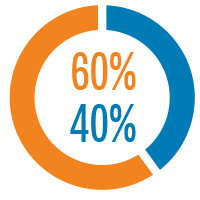
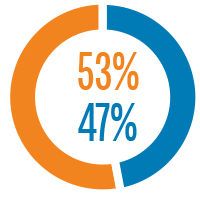
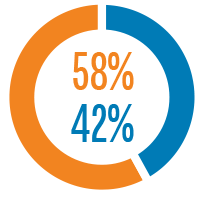
In the 2018 Employee Engagement Survey, we asked team members their level of agreement with three important statements related to diversity and inclusion, and saw an increase from the prior year's survey:
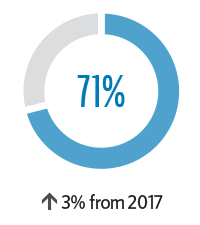
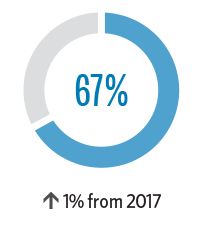
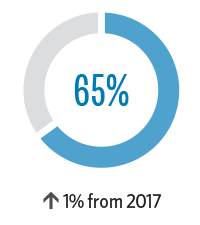
To ensure we establish and maintain an accurate and upward trend for this important strategic measure, we will continue to use the same survey questions from year to year.
Recruiting — There's a Place for You
We take a proactive approach in our recruitment efforts. We participated in 26 outreach events across the state targeted to diverse audiences, including women, underrepresented minorities, disabled persons, regional college students, and veterans. Our message is important – there is a place for you at CalPERS. We look for people who also have a desire to serve those who serve California.
In addition, we invested in our future workforce by recruiting and developing talent through internship and apprentice programs. We had 15 student assistants and two IT apprentices during the 2018-19 fiscal year. At the end of their apprenticeship, our apprentices will meet the minimum qualifications for the Information Technology Associate classification.
Our Culture Influences Our Community & Beyond
Serving Our Members
We meet members where they reside through our eight Regional Offices throughout California. When surveyed, more than 90% of our respondents said they were satisfied with the services they received through our Customer Contact Center and Regional Offices. We're also able to serve customers in multiple languages through our vast array of language proficiencies.
Each year we also conduct a series of CalPERS Benefits Education Events across the state, providing opportunities for members to learn more about their benefits. We hosted 10 of these events in 2018-19, which drew nearly 12,000 attendees.
Our number one priority is to ensure our members will be able to count on their pension and health benefits when they need them. One way we do this is by equipping our employers with the skills and knowledge they need to effectively administer those vital benefits. For two decades, we've hosted an annual CalPERS Educational Forum for state, public agency, and school employers throughout California who contract with us to provide retirement and health benefits to our members. This year, the event drew a total of 909 attendees, representing 438 employer agencies.
When our members are facing their greatest needs — as in times of disaster or emergency — our team takes the initiative to reach out and offer assistance. This was especially evident when we helped members impacted by natural disasters, ensuring they wouldn't experience benefit interruptions. This included:
- Approximately 140 retirees impacted by two major California wildfires
- Four retirees impacted by Hurricane Michael
- Fire relief support for 440 other members
As we serve our CalPERS members, our members serve California.
Enhancing Our Local Economy
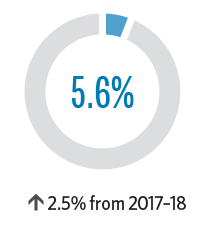
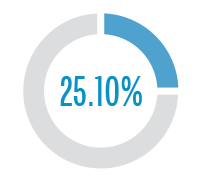
In 2005, we made the commitment to award 3% of all competitive contracts to Disabled Veteran Business Enterprises (DVBE). We also established an overall Small Business/Micro Businesses (SB/MB) contract participation goal of 25%, in keeping with state public contract laws. This commitment enhances California's local economy and enriches our experience by doing business with a wide range of supply and service vendors. Our DVBE participation level was 5.6%, which surpassed last year's DVBE participation by 2.5%. We also achieved our goal for SB/MB contract participation.
Other Contracting & Procurement Highlights for the Fiscal Year

If you have a Small Business/Micro Business or Disabled Veteran Business Enterprise, learn about Doing Business with CalPERS (PDF).
Influencing Investment Practices
Corporate board diversity is a strategic priority of our investment office because of the multitude of studies that show companies with diverse boards and executives have better financial performance than less diverse companies1. Better financial performance leads to better investment returns, which improves our ability to pay promised benefits to our members. More than half of every dollar we pay out in benefits comes from our investment returns. To learn more about our investment beliefs, view CalPERS' Governance & Sustainability Principles (PDF).
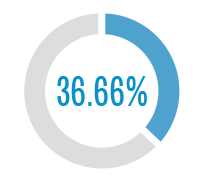
During the reporting year, we engaged 700 companies to encourage greater diversity in their boards of directors. As a result, 53% added diversity to their board.
We used our proxy voting power to oppose more than 700 directors at over 200 companies where our engagement efforts didn't result in constructive outcomes. We also filed 94 shareowner proposals seeking adoption of a majority vote standard for director elections. Ultimately, we withdrew 57 of these proposals after successful negotiations, and an additional 24 companies since added a diverse director.
In June, we partnered with California State Teachers' Retirement System (CalSTRS) to host our third Diversity Forum, which offered 400 investment industry and corporate executives a unique opportunity to explore the connection between diversity, human capital, and performance. We received an overwhelmingly positive response from event attendees on the thoughtfulness of the speakers, the quality of dialogue, and the concepts explored.
Serving Our Community
For several decades, we've committed to supporting worthy causes that make a difference in our communities and participated in campaigns and events that have resulted in contributions to specific charities. Our community outreach efforts demonstrate our Core Values of Integrity, Quality, Openness, Respect, Accountability, and Balance.
The following voluntary activities from 2018-19 highlight our commitment to the community we serve:
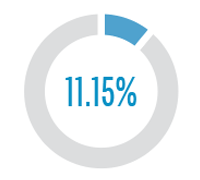
A total of 17% of our team members participated in voluntary payroll deductions to support charitable organizations they feel passionate about through Our Promise. We also raised over $3,000 to support local and regional nonprofits through this annual statewide fundraising event.
We collectively donated over 44,000 pounds of food and more than $10,500 for families, individuals, and food closets in the Greater Sacramento area through State Employees' Food Drive. This contribution was bolstered with donations raised by our Run to Feed the Hungry team, which participated in the nation's largest Thanksgiving Day charity fun run.
Four team members served as CCI puppy raisers, each committing 18 months of their time. They provided the dogs with obedience training and socialization to prepare them for advanced training and eventual permanent placement with someone who has a disability.
Our team members provided over 390 pounds of clothing donations to these two organizations that help homeless men and women rebuild their lives and successfully enter the workforce.
We collaborated with the CalPERS Café to raise over $600, which funds lunches for a school that serves homeless children in Sacramento.
Our efforts raised over $1,000 for the Sacramento region's primary provider of crisis intervention services for survivors of domestic violence and sexual assault.
We partnered with Vitalant, a network of more than 125 community blood centers, to offer five on-site blood and platelet donation opportunities to our team members. These donations make a monumental impact to save the lives of people across the country.
Looking Ahead
As we look forward to another year of serving the public servants of California, we continue to build upon the foundation of our D&I program. D&I isn't a social or political cause – it's a business imperative that enhances the quality of services we're able to provide to our members.
We'll continue to advocate for board diversity and stay focused on long-term investment success.
We'll continue to make CalPERS a more inclusive workplace that leverages diversity and increases team member engagement, contributing to our performance as a public trust.
Most importantly, we'll continue our promise to pay our members' pensions and provide cost-effective, innovative healthcare options for generations to come.
1Hunt, V., Prince, S., Dixon-Fyle, S., & Yee, L. (2018, January). Delivering through Diversity;
Credit Suisse. (2019, October 10). Gender diversity is good for business;
Morgan Stanley. (2016, May 11). Linking Gender Diversity & Market Returns.